Download
1 / 21
220 likes | 480 Vues
Release Management of Non-Zero Defect Software. by Frank Tsui and Linda Brooks Frank Tsui is with Southern Polytechnic State University and Linda Brooks is with MAPICS Incorporated . Release Management Activities. Project Planning. Product Release. . . . Define and Setup

E N D
Release Management of Non-Zero Defect Software by Frank Tsui and Linda Brooks Frank Tsui is with Southern Polytechnic State University and Linda Brooks is with MAPICS Incorporated
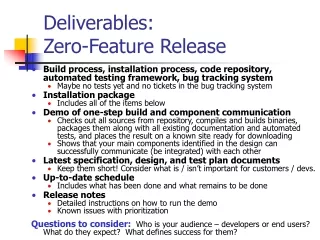
Release Management Activities Project Planning Product Release . . . Define and Setup Objectives & Goals Deciding on Product Release
Release Management • A set of guidelines which describe the objectives and goals that must be satisfied prior to software release • A set of people responsible for making decisions on • appropriateness of the guidelines • satisfaction of the objectives and goals • appropriate trade-off(s) • software release
Objectives and Goals • Objective : “Provide a Release with --------” • Goals : • Functional goals • Performance goals • Quality goals • . • . • .
Release Management Team - Development Manager(s) - Technical Lead(s) - QA Manager - Test Manager - Build/Packaging Manager Do we all agree with the definitions, goals, and objectives ? Have we met all the goals ? We have not met all the goals ---- do we still release the product ?
Quality Analysis and Goals • Many ways to classify and analyze the failures and defects • Type of failures/defects • Cause of failures/defects • Severity of failures/defects • Number of failures/defects • Failure trend • Weekly moving defect arrival rate • . • .
In the Test-Fix Cycle • Test coverage goals are met • Problem discovery/arrival rate has decreased substantially • Problem resolutions are validated and integrated • Should there be some “prioritization” to the fixes ? • By Severity of the Failure Incident ?
Severity of Failure Incidents/Defects • Failure severity …. a measure of the consequence of the failure • Viewed from the user perspective • A simple classification may be 2-levels: • Major problem • Minor problem • Does the number of severity levels matter?
Severity Levels Failure causes system crash and the recovery time is extensive; failure causes loss of function and data and there is no workaround. Severity 1 Failure causes a loss of function or data but there is manual workaround to temporarily accomplish the tasks Severity 2 Failure causes a partial loss of function or data where user can accomplish most of the tasks with a small amount of workaround Severity 3 Failure causes cosmetic and minor inconveniences where all the user tasks can still be accomplished Severity 4
Some Possible Release Management “Goal” Alternatives • All known problems are resolved prior to release of the software • All known problems of Severity Levels 1, 2 and 3 are resolved prior to releasing the software • All known Severity Levels 1 and 2 failures are resolved prior to release of the software • All known Severity Level 1 failures are resolved prior to release of the software
Which One Should We Use ? Or may be some combination should be considered ? Or something else ought to be considered?
Value of Quality and Cost of Quality • The software user/customer : “there should be no known problem” • The software provider: quality has a value and a cost • value of quality is related to the support effort where quality is valued more when less support is required • cost of the quality is related to the effort required to discover and fix the problems where the cost increases as more problems are discovered and fixed
Value of Quality • In organizations where there is historical cost information, the relative value of quality (or the post release support cost) can be stated by severity levels. • Severity Level 1 - 6x • Severity Level 2 - 3x • Severity Level 3 - 2x • Severity Level 4 - .5x
Cost of Quality • In organizations where there is historical cost information, the relative cost of quality (or pre-release problem fix cost ) can be stated by severity levels. • Severity Level 1 - 2x • Severity Level 2 - 1x • Severity Level 3 - .5x • Severity Level 4 - .2x
Cutoff Index • The ratio of value of quality and cost of quality by severity level is defined as the cutoff index value. • Severity Level 1 : 6x/2x or 3 • Severity Level 2 : 3x/x or 3 • Severity Level 3 : 2x/.5x or 4 • Severity Level 4 : .5x/.2x or 2.5 • Where the cutoff index drops in value is a place to consider not resolving all the known problem • A Quality Goal : With a cutoff index of 2.5, all known severity levels 1,2, and 3 problems should be resolved prior to release.
Some Reasons Why the Goal May Not Be Attained • Aggressive Schedule • More Problems Found than Anticipated • Loss of Key Resources • Mismanaged Scope Creep • . • .
Can We Relax the Goal ? Release Date is Coming Up !!! Do we have to resolve all the problems that were set as the goal if we, now, know it is impossible to achieve it ?
Likelihood Index • In some instances, the release management team is asked to decide on releasing software that is not projected to meet all of its quality goals. (There may be a few unresolved problems) • A problem likelihood index is used • a “guesstimate” of the likelihood of a problem occurring at the customer site. • The index value range from 0.1 to 1.0 where .1 represents very low probability of occurrence and 1 represents sure occurrence
Likelihood Index Usage • When there are a few unresolved failures still remaining and the schedule is pressing, then utilize likelihood index to help in calculating individual cutoff index and compare against the goal.
Likelihood Index Usage Example • Consider a severity level 3 failure that carries a relative support cost (value of quality) of 2x and a relative problem fix cost (cost of quality) of .5x • If the failure is deemed to have a likelihood index of .2 for most users, then the support cost (value of quality) is reduced to .2 * 2x = .4x • The cutoff index for the failure would be .4x/.5x or .8 which is much lower than the earlier stated goal of 2.5 for the cutoff index. (So this particular problem may be left unresolved prior to release.)
Release Management Activities Project Planning Product Release . . . Define and Setup Objectives & Goals Deciding on Product Release “Using” -Problem Severity Levels -Cutoff Index -Cutoff Index Value -Likelihood Index Value