Gene Expression Patterns of Glyma03g31980 and Glyma17g07330 in Soybean Tissues
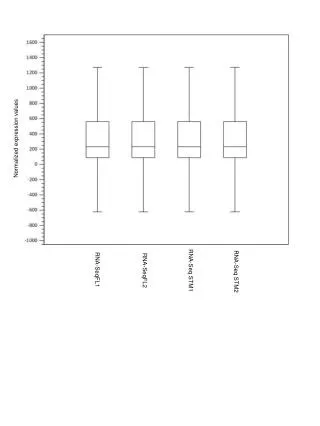
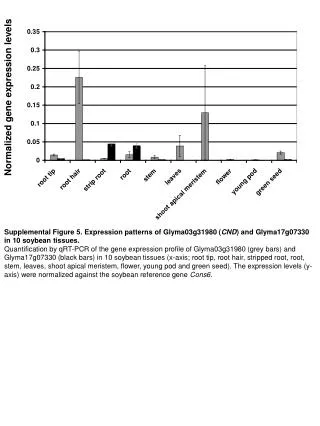
This study presents the quantification of gene expression levels for Glyma03g31980 (CND) and Glyma17g07330 across ten different soybean tissues. Using qRT-PCR, expression profiles were analyzed, represented by grey bars for Glyma03g31980 and black bars for Glyma17g07330. The tissues examined include root tip, root hair, stripped root, root, stem, leaves, shoot apical meristem, flower, young pod, and green seed. Expression levels were normalized against the soybean reference gene Cons6, allowing for precise comparison across tissues.

Gene Expression Patterns of Glyma03g31980 and Glyma17g07330 in Soybean Tissues
E N D
Presentation Transcript
Normalized gene expression levels shoot Supplemental Figure 5. Expression patterns of Glyma03g31980 (CND) and Glyma17g07330 in 10 soybean tissues. Quantification by qRT-PCR of the gene expression profile of Glyma03g31980 (grey bars) and Glyma17g07330 (black bars) in 10 soybean tissues (x-axis; root tip, root hair, stripped root, root, stem, leaves, shoot apical meristem, flower, young pod and green seed). The expression levels (y-axis) were normalized against the soybean reference gene Cons6.