Addressing Underage Alcohol Use Trends
An informative presentation discussing the prevalence and statistics of underage alcohol use, highlighting the impact on teenagers. Learn about the patterns, consequences, and access of alcohol among youth.

Addressing Underage Alcohol Use Trends
E N D
Presentation Transcript
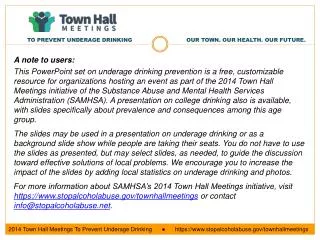
NOTE A note to users: This PowerPoint set on underage drinking prevention is a free, customizable resource for organizations hosting an event as part of the 2014 Town Hall Meetings initiative of the Substance Abuse and Mental Health Services Administration (SAMHSA). A presentation on college drinking also is available, with slides specifically about prevalence and consequences among this age group. The slides may be used in a presentation on underage drinking or as a background slide show while people are taking their seats. You do not have to use the slides as presented, but may select slides, as needed, to guide the discussion toward effective solutions of local problems. We encourage you to increase the impact of the slides by adding local statistics on underage drinking and photos. For more information about SAMHSA’s 2014 Town Hall Meetings initiative, visit https://www.stopalcoholabuse.gov/townhallmeetings or contact info@stopalcoholabuse.net.
Event Title EVENT LOCATION EVENT DATE AND TIME EVENT SPEAKER
Prevalence Underage alcohol use: How Many and who
prevalence • More young people use alcohol than any other drug, including tobacco or marijuana. • Substance Abuse and Mental Health Services Administration. (2013). Report to Congress on the prevention and reduction of underage drinking. From https://www.stopalcoholabuse.gov/resources/reporttocongress/RTC2013.aspx(accessed March 4, 2014).
prevalence • About one out of every four 12- to 20-year-olds reported past-month drinking in 2012. • Of this number: • 15.3 percent were binge drinkers (having at least five drinks on one occasion during the past month); and • 4.3 percent were heavy drinkers (binge drinking on at least 5 days out of the past month). • Substance Abuse and Mental Health Services Administration. (2013). Results from the 2012 National Survey on Drug Use and Health: Summary of national findings. From http://www.samhsa.gov/data/NSDUH/2012SummNatFindDetTables/NationalFindings/NSDUHresults2012.htm#ch3.2 • (accessed March 4, 2014).
prevalence • Alcohol use begins early and increases rapidly with age. • In 2012, underage drinking was reported by: • 2.2 percent of 12- or 13-year-olds; • 11.1 percent of 14- or 15-year-olds; • 24.8 percent of 16- or 17-year-olds; and • 45.8 percent of 18- to 20-year-olds. • Substance Abuse and Mental Health Services Administration. (2013). Results from the 2012 National Survey on Drug Use and Health: Summary of national findings. From http://www.samhsa.gov/data/NSDUH/2012SummNatFindDetTables/NationalFindings/NSDUHresults2012.htm#ch3.2(accessed March 4, 2014).
Prevalence • On an average day in 2011, 457,672 teenagers, ages 12 to 17, consumed alcohol. • Substance Abuse and Mental Health Services Administration. (2013). A day in the life of American adolescents: Substance use facts update. The CBHSQ Report. From http://www.samhsa.gov/data/2K13/CBHSQ128/sr128-typical-day-adolescents-2013.htm (accessed March 4, 2014).
prevalence • Rates of past-month alcohol use vary by racial/ethnic groups: • American Indian/Alaska Native (22.3 percent); • Asian (13.0 percent); • Black (18.0 percent); • Hispanic (23.2 percent); and • White (27.4 percent). • Substance Abuse and Mental Health Services Administration. (2013). Results from the 2012 National Survey on Drug Use and Health: Summary of national findings. From http://www.samhsa.gov/data/NSDUH/2012SummNatFindDetTables/NationalFindings/NSDUHresults2012.htm#ch3.2(accessed March 4, 2014).
prevalence • The gap in alcohol use between girls and boys is narrowing: • Eighth-grade girls and boys now have similar rates of alcohol use, binge drinking, and drunkenness; and • Certain consequences of underage drinking (e.g., unintended pregnancy, sexually transmitted diseases, and interpersonal violence) are expected to increase. • Johnston, L. D., O’Malley, P. M., Bachman, J. G., & Schulenberg, J. E. (2012). Monitoring the Future national survey results on drug use, 1975–2011: Volume I, Secondary school students. From http://monitoringthefuture.org/pubs/monographs/mtf-vol1_2011.pdf (accessed March 4, 2014).
prevalence • College drinking often begins in high school. • Amonghigh school seniors: • 39 percent report drinking in the previous month; and • 90 percent say that it is fairly easy or very easy to get alcohol. Johnston, L. D., O’Malley, P. M., Miech, R. A., Bachman, J. G., & Schulenberg, J. E. (2014). Monitoring the Future national survey results on drug use: 1975–2013: Overview, Key findings on adolescent drug use. From http://monitoringthefuture.org//pubs/monographs/mtf-overview2013.pdf(accessed March 4, 2014).
Access How youth obtain alcohol
access • In 2012, 28.2 percent of underage drinkers paid for their own alcohol: • 20.4 percent paid someone else to buy it for them; and • 7.6 percent purchased it themselves. • Substance Abuse and Mental Health Services Administration. (2013). Results from the 2012 National Survey on Drug Use and Health: Summary of national findings. From http://www.samhsa.gov/data/NSDUH/2012SummNatFindDetTables/NationalFindings/NSDUHresults2012.htm#ch3.2 (accessed March 4, 2014).
access • In 2012, of underage drinkers who got their alcohol • for free: • 36.6 percent got it from a nonrelative age 21 or older; • 18.8 percent got it from another underage person; and • 23 percent got it from a parent or guardian or other relative age 21 or older. • Substance Abuse and Mental Health Services Administration. (2013). Results from the 2012 National Survey on Drug Use and Health: Summary of national findings. From http://www.samhsa.gov/data/NSDUH/2012SummNatFindDetTables/NationalFindings/NSDUHresults2012.htm#ch3.2(accessed March 4, 2014).
Consequences Consequences and costs for individuals and communities
consequences • Underage drinking contributes to: • Brain impairment; • Academic problems; • Physical and sexual assaults; • Alcohol dependence; • Injury; and • Death from traffic fatalities, suicide, homicide, and alcohol and drug poisoning. • Substance Abuse and Mental Health Services Administration. (2013). Report to Congress on the prevention and reduction of underage drinking. From https://www.stopalcoholabuse.gov/resources/reporttocongress/RTC2013.aspx(accessed March 4, 2014).
consequences • Since 1999, alcohol-related hospitalizations among 18- to 24-year-oldshave increased by: • 25 percent for alcohol overdoses; • 56 percent for drug overdoses; and • 76 percent for combined alcohol/drug overdoses. • White, A. M., Hingson, R. W., Pan, I. J., & Yi, H. Y. (2011). Hospitalizations for alcohol and drug overdoses in young adults ages 18–24 in the United States, 1999–2008: Results from the nationwide inpatient sample. Journal of Studies on Alcohol and Drugs, 72(5), 774–786.
consequences • The younger the age at which young people begin to drink, the greater the percentage diagnosed with an alcohol problem later in life: • Age 13 or younger: 40 percent diagnosed; • Age 17: 24.5 percent diagnosed; • Age 18: 16.6 percent diagnosed; and • Age 21: 11 percent diagnosed. • Grant, B. F., & Dawson, D. A. (1997). Age at onset of alcohol use and its association with DSM-IV alcohol abuse and dependence: Results from the National Longitudinal Alcohol Epidemiologic Survey. Journal of Substance Abuse, 9, 103–110.
Consequences • In 2012, 889,000 youth ages 12 to 17 needed treatment for an alcohol use problem. Of these: • 76,000 received treatment at a specialty facility; and • ≈ 814,000 needed but did not receive treatment. • Substance Abuse and Mental Health Services Administration. (2013). Results from the 2012 National Survey on Drug Use and Health: Summary of national findings. From http://www.samhsa.gov/data/NSDUH/2012SummNatFindDetTables/NationalFindings/NSDUHresults2012.htm#ch7.3.3 • (accessed March 4, 2014).
consequences • In 2010, the costs of underage drinking to the United States was $62.2 billion. • Cost per problem (in billions): • Youth violence: $35.1; • Traffic crashes: $10; • High-risk sex: $5.1; • Youth property crime: $5.2; • Fetal alcohol spectrum among mothers ages 15 to 20: $1.3; and • Other (youth injury, poisonings and psychoses, treatment): $5.4. • Underage Drinking Enforcement Training Center. (2011). Underage drinking costs. From http://www.udetc.org/UnderageDrinkingCosts.asp(accessed March 4, 2014).
Prevention Progress Prevention works!
Prevention progress • Fewer young people ages 12 to 20 are reporting past-month drinking: • 2012: 9.3 million (24.4 percent of age group); and • 2002: 10.7 million (28.8 percent of age group). • Substance Abuse and Mental Health Services Administration. (2013). Results from the 2012 National Survey on Drug Use and Health: Summary of national findings. From http://www.samhsa.gov/data/NSDUH/2012SummNatFindDetTables/NationalFindings/NSDUHresults2012.htm#ch3.2(accessed March 4, 2014). • Substance Abuse and Mental Health Services Administration. (2003). Results from the 2002 National Survey on Drug Use and Health: National findings. From http://www.samhsa.gov/data/nhsda/2k2nsduh/Results/2k2Results.htm#chap3 (accessed March 4, 2014).
Prevention Progress • Average age of first use of alcohol among those under age 21 is increasing: • 2012: 16 years; and • 2002: 15.5years. • Substance Abuse and Mental Health Services Administration. (2013). Results from the 2012 National Survey on Drug Use and Health: Summary of national findings. From http://www.samhsa.gov/data/NSDUH/2012SummNatFindDetTables/NationalFindings/NSDUHresults2012.htm#ch3.2(accessed March 4, 2014).
Prevention progress • Among 8th-, 10th-, and 12th-grade students: • Current drinking and binge drinking are at their lowest points since at least the mid-1990s; and • Disapproval of binge drinking is increasing among 10th- and 12th-grade students. Johnston, L. D., O’Malley, P. M., Miech, R. A., Bachman, J. G., & Schulenberg, J. E. (2014). Monitoring the Future national survey results on drug use: 1975–2013: Overview, Key findings on adolescent drug use. From http://monitoringthefuture.org//pubs/monographs/mtf-overview2013.pdf (accessed March 4, 2014).
Prevention progress • The number of teens who drive while impaired has dropped by more than half— 54 percent—since 1991. • Centers for Disease Control and Prevention. (2012). Teen drinking and driving: A dangerous mix. CDC Vital Signs. From http://www.cdc.gov/VitalSigns/TeenDrinkingAndDriving (accessed March 4, 2014).
Environmental Prevention Approaches that work
Environmental prevention • Environmental prevention means changing the environment to make alcohol less accessible and appealing to people under age 21.
Environmental prevention • Environmental prevention targets four key areasthat influence alcohol problems: • Access and availability; • Policy and enforcement; • Community norms; and • Media messages.
Environmental PREVENTION • Responsible beverage service training: • Eliminates lax enforcement of minimum legal drinking age laws by on- and off-premises alcohol retailers; and • Trains servers to increase familiarity with state and local restrictions on: • Alcohol service; • Failure to recognize false identification; and • Continued service to intoxicated patrons.
Environmental prevention • Alcohol compliance checks: • Deter alcohol outlets from selling alcohol to underage young people; and • Involve law enforcement officials, who supervise undercover youth attempting to purchase alcohol: • Penalties are imposed on the alcohol outlet if the attempt is successful.
Environmental prevention • Restrictions on low-price, high-volume (“happy hour”) drink specials that: • Reduce excessive drinking and consequences by limiting, for example: • Drink promotions, such as reduced pricing during specific days or times; • Free beverages or unlimited beverages at a set price and time; • Increased drink volume; and • Drinks offered as prizes.
Environmental prevention • Controls on alcohol outlet location and density: • Apply regulatory authority, implemented through licensing or zoning processes, to reduce or limit the number of alcohol outlets in a given area.
ENVIRONMENTAL PREVENTION • Sobriety checkpoints: • “… traffic stops where law enforcement officers systematically select drivers to assess their level of alcohol impairment. The goal of these interventions is to deter alcohol-impaired driving by increasing drivers’ perceived risk of arrest.” • Checkpoints, when combined with a vigorous awareness campaign, tend to decrease alcohol-related traffic crashes and fatalities among youth. • Centers for Disease Control and Prevention. (N.D.). Research update: Sobriety checkpoints are effective in reducing alcohol-related crashes. From http://www.cdc.gov/MotorVehicleSafety/Impaired_Driving/checkpoint.html(accessed March 4, 2014). • National Highway Traffic Safety Administration. (April 2006). Low-staffing sobriety checkpoints. From http://www.nhtsa.gov/people/injury/enforce/LowStaffing_Checkpoints (accessed March 4, 2014).
Environmental prevention • Social host liability laws: • Noncommercial servers of alcohol (homeowners or parents) are held liable in the event that they provide alcohol to a minor or an obviously inebriated individual whose alcohol use later contributes to injury or death to a third party.
Environmental prevention • Restricted sales of alcohol at public events: • Implementation of policies, voluntary or mandated by local legislation, which control the availability and use of alcohol at concerts, street fairs, sporting games, tailgate parties, and other public venues.
Environmental prevention • Increased taxes on sales of alcohol: • Price affects how much people will consume, thereby reducing the number of alcohol-related problems people will cause or experience.
Resources For more information
Websites • For more information about underage drinking prevention: • Stop Underage Drinking • Alcohol Policy Information System • College Drinking: Changing the Culture • Underage Drinking Enforcement Training Center