Download
1 / 51
510 likes | 647 Vues
2012 SAFE BOATING AWARENESS SURVEY Consumer Research Results Report Prepared for: Canadian Safe Boating Council Prepared by: McCullough Associates Date: August 7, 2012. Table of Contents. Slide #. Introduction 3 Research Objectives & Methodology 4

E N D
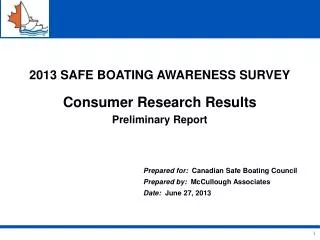
2012 SAFE BOATING AWARENESS SURVEY Consumer Research Results Report Prepared for: Canadian Safe Boating Council Prepared by: McCullough Associates Date: August 7, 2012
Table of Contents Slide # • Introduction3 • Research Objectives & Methodology 4 • Summary of Key Findings & Implications6 • Detailed Findings 14 • Boating Participation 15 • Awareness of Safe Boating Messages 18 • Safe Boating Attitudes & Behaviours 29 • Wearing PFDs 36 • Cold Water 43 • Appendix 46
Research Objectives • Measure & track awareness of safe boating messages communicated by the North American Safe Boating Awareness Week annual communication campaign • Identify how well specific campaign messages are being communicated, in the areas of “Wearing PFDs”, “drinking & boating”, “preparedness”, “cold water” and “boating training/education” • Identify who the campaign is reaching and opportunities to improve its reach & impact • Measure & track boating safety attitudes and behaviours among Canadian boaters, and how they have been affected by awareness of the NASBAW campaign messages.
Research Methodology • National online survey as part of Ipsos Reid’s eNation weekly omnibus survey • Fieldwork conducted May 30 – June 4, 2012 • n = 1,017 Canadian adults, nationally representative of the Canadian population • Note: Due to a sampling irregularity at Ipsos, the 35-44 year-old age group is under-represented in the 2012 sample and the 45-54 year-old age group is over-represented. In total the 35-54-year-old age group is in-line with population, and other age groups and demographics are largely representative of the Canadian population. Analysis indicates this does not materially affect the interpretation of the overall 2012 results. • Most Safe Boating Awareness Survey questions asked of n=436 subgroup of the Canadian population who participate in recreational boating activities at least occasionally • Including pleasure powerboating/cruising/waterskiing/wakeboarding, fishing from a boat, riding a personal watercraft, canoeing, kayaking, sailing, sailboarding/windsurfing &/or boating in other unpowered craft. • See separate Appendix for the survey questionnaire • On a sample size of 1,017, results are accurate 19 times out of 20 to within +/-3% • On a sample size of 436, results are accurate 19 times out of 20 to within +/-5% • Circles and squares are used throughout this report to indicate differences that are significant at the 95% confidence level. Differences that are “approaching significance” (80% confidence level) are indicated with dotted circles and squares • Solid arrows are used to indicate changes in 2012 vs prior wave 2010 and earlier results that are significant at the 95% level. Dotted arrows indicated changes that are “approaching significance.” • No Safe Boating Awareness Survey research was conducted in 2011, hence no comparisons to 2011 in this report.
Summary of Key Findings • Boating Participation: • Almost half (43%) of Canadian adults participate in recreational boating activities. • Fishing, pleasure powerboating and canoeing are the most popular boating activities. • No significant change in boating participation in 2012 compared to 2010 & 2009. • Awareness of Safe Boating Messages: • 2012 aided awareness of NASBAW boating safety campaign messages is in-line with 2006 to 2008 levels – still reaching over half of boaters (54%), but not as high as 2009 and 2010 levels. • More boaters “highly aware” (of 5+ messages) in 2012 (16%) than in 2007 & 2008 (11%), and in-line with 2009 & 2010. • Lower message awareness in 2012 than 2010 in most boating activity subgroups; still higher than 2006-08 levels amongst fishermen, powerboat passengers and PWC riders. • Lower message awareness in 2012 than 2010 in Ontario and Atlantic regions, amongst male boaters, and boaters 45 - 54 years of age. • Below prior years 2006-2008 levels in Ontario and Atlantic, and amongst boaters 45 – 54 yrs.
Summary of Key Findings • Awareness of Safe Boating Messages (cont’d): • Lower awareness in 2012 than 2010 for “get your PCOC” safe boating message; and slightly lower for “wear your lifejacket”; highest awareness for “don’t drink and boat”, “get your PCOC” and “wear your lifejacket” messages. • 2012 awareness higher than earlier 2006-2008 levels for “get your PCOC” and “review your checklist” messages. • Desired Safe Boating Attitudes/Behaviours: • Weaker PFD, cold water and boating education attitudes and behaviour in 2012; maintained position on drinking & boating and preparedness. • Anglers and powerboat passengers in particular have poorer PFD-wearing attitudes & behaviours in 2012 compared to 2010; other boating subgroups maintained. • Weaker overall cold water attitudes reflect weaker attitudes in most boating activity sub-groups. • More fishermen, boat drivers, passengers and canoeists/ kayakers say they have their PCOC in 2012 than in 2010. • No significant changes in 2012 vs 2010 for “drinking & boating” nor “preparedness” attitudes & behaviours, by boating activity. • Still evidence of stronger safe boating attitudes and behaviours amongst those aware of SBAW messages; although not as strong impact as in 2010.
Summary of Key Findings • Wearing PFDs: • No significant changes from wave to wave, although slightly fewer boaters in 2010+2012 saying they “Always” wear a PFD, compared to 2008+2009. • Somewhat fewer younger, B.C. and Atlantic boaters “Always” wearing PFDs in 2010+2012 than 2008+09. • Less claimed wearing of PFDs in 2010+2012 than 2008+09 among powerboat passengers. • More belief in 2012 that “I can put PFD on if I need to” as a top reason boaters are not always wearing their PFD. • Also more belief in 2010+12 than 2008+09 that “it’s good enough to be a good swimmer“ as another top reason for not always wearing their PFD. • Rough water or being out in a kayak are the conditions that most motivate boaters to wear their PFDs; followed by being out in a canoe or small sailboat. • Positive impact on intent to wear PFDs evident for awareness of SBAW messages in both 2012 and 2010.
Summary of Key Findings • Cold Water: • About one-third (36%) of boaters say they’ve heard messages about the risks of cold water. • Less generation of awareness of cold water risks from boating safety organizations in 2012 than 2010 – ie. via their brochures/pamphlets and instructors. • Also somewhat more awareness generated by radio and outdoor/ mall/ transit media; and somewhat less recognition of hearing about cold water risks via news coverage/articles.
Implications (for discussion) • 2012 NASBAW campaign was effective in getting its safety message out to Canadian boaters • Reached over half of boaters (54%) with its safe boating messages • Similar overall message reach as for the 2006, 2007 & 2008 campaigns, although not quite as high as in 2009 and 2010. • Higher message awareness reach than 2006-2008 levels amongst anglers (who continue to be a key boating safety target group), powerboat passengers and PWC riders; and maintained vs 2006-2008 amongst powerboat drivers and and canoeists/kayakers • Higher awareness than 2006-2008 for “get your PCOC”, “checklist preparedness” and “wear lifejacket for cold water preparedness” messages; and maintained awareness for all other messages vs 2006-2008. • Continued to build “multiple message awareness”, with more boaters; more are “highly aware” (of 5+ messages) in 2012 than in 2006 to 2008, and in-line with 2009 and 2010.
Implications (for discussion) • The NASBAW campaign continues to make a difference • Still solid, positive impact, with boaters aware of NASBAW messages more likely to have desired safe boating attitudes and intended behaviours, than those not aware of the campaign • Positive impact with boaters aware of NASBAW messages more likely to intend to wear their PFDs – overall, and in risky conditions
Implications (for discussion) • What can be done to further improve campaign awareness & impact … back up to 2009-2010 levels and beyond? • In Ontario and Atlantic Canada, where 2012 message awareness is down? • For “don’t drink & boat” and PFD messages, for which awareness is unchanged? • To turn around the slight erosion in intent to wear PFDs, which seems to trace most to younger boaters (18-34) and boat passengers? • Is the lower sourcing of cold water message awareness from news coverage/articles reflective of less uptake on that particular message via PR? Or less uptake overall? • Did boating organizations provide less support for NASBAW messages in their brochures/materials and courses than in previous years? Or is less sourcing of cold water message awareness from that source reflective of less uptake on the cold water messages in particular • Is it time for a significant creative refreshment in terms of how we express CSBC safe boating messages to boaters, to increase how much we get noticed and have impact? • Even if #’s of impressions and message frequency are up, how well are they registering?
Almost half (43%) of Canadian adults participate in recreational boating activities 2012 - % of Canadian adults participating in boating activities at least occasionally (n=1017) • Fishing, pleasure powerboating and canoeing are the most popular boating activities Total Boaters (net) Powerboating (net) • Fishing (from boat, canoe, craft) • Pleasure powerboating • Drive powerboat Passenger only (all types of craft) Ride PWC Non-powerboating (net) • Paddling (net) • Canoeing • Kayaking • Sailing • In other non-power craft 43 34 25 20 12 29 3 24 19 16 9 4 7 2. Which of the following activities do you participate in, at least occasionally?
No change in boating participation in 2012 compared to 2010 & 2009; still almost half of Canadian adults involved in boating • No change in 2012 participation for any of the boating subgroups, after post-recession dip in 2009 • Over 6 years since 2006, small decline in net total non-powerboating participation (24% vs 29%) and increase in kayaking (9% vs 6%). Other boating activities unchanged. % of Canadian adults participating in boating activities 2. Which of the following activities do you participate in, at least occasionally?
2012 aided awareness of NASBAW boating safety campaign messages is in-line with 2006 to 2008 levels – still reaching over half of boaters (54%) but not as high as 2009 and 2010 levels % of boating activity participants who are Aware of boating safety messages Total Boating (net) (n=436) • More boaters “highly aware” (of 5+ messages) in 2012 (16%) than in 2007 & 2008 (11%), and in-line with 2009 & 2010. 2012 2010 2009 2008 2007 2006 54 16 62 14 13 60 52 11 11 51 56 13 Powerboating (net) (n=351) 58 18 2012 2010 2009 2008 2007 2006 16 65 15 62 53 12 53 12 59 15 Non-powerboating (net) (n=237) Highly Aware - % saw or heard 5+ messages (of 9) 14 48 2012 2010 2009 2008 2007 2006 62 12 Total Aware - % saw or heard 1+ messages (of 9) 12 60 10 56 13 51 13 56 1. Which of the following boating safety messages have you seen or heard during the last few weeks? (eg. on TV, radio, in newspapers, magazines, on-line, etc.)
Lower awareness in 2012 than 2010 in most boating activity subgroups; still higher than 2006-08 levels amongst fishermen, powerboat passengers and PWC riders % of boating activity participants who areAware of boating safety messages (1+) 2012Change vs2006-08 = = = 201069 66 75 57 55 62 68 200966 59 76 52 78 58 64 2008 56 51 65 45 51 53 71 2012 Fishing (n=256) Pleasure powerboating (n=196) Drivers of powerboats (n=132) Passengers (only) (n=299) Ride PWC (n=35) Canoeing & Kayaking (n=188) Sailing (n=35) 63 21 52 17 66 21 56 19 Highly Aware - % saw or heard 5+ messages Total Aware - % saw or heard 1+ messages 28 71 14 50 21 46 1. Which of the following boating safety messages have you seen or heard during the last few weeks? (eg. on TV, radio, in newspapers, magazines, on-line, etc.)
Lower message awareness in 2012 than 2010 in Ontario and Atlantic regions, amongst male boaters, and boaters 45 - 54 years of age • Below prior years 2006-2008 levels in Ontario and Atlantic, and amongst boaters 45 – 54 yrs. % of boating activity participants who areAware of boating safety messages 2012Change vs2006-08 = = = = = = = 201059 62 64 65 66 57 55 65 70 5059 200960 58 64 60 60 60 67 63 67 4356 Age: 18-34 35-44* 45-54 55+ Gender: Male Female Region: Atlantic Quebec Ontario Prairies B.C. 2012 10 54 28 52 46 15 63 26 21 58 Highly Aware - % saw or heard 5+ messages 49 11 Total Aware - % saw or heard 1+ messages 12 27 61 13 15 54 54 18 59 25 * Very small base size for 35-44 yrs in 2012 1. Which of the following boating safety messages have you seen or heard during the last few weeks? (eg. on TV, radio, in newspapers, magazines, on-line, etc.)
Lower awareness in 2012 than 2010 for “get your PCOC” safe boating message; and slightly lower for “wear your lifejacket” • Highest awareness for “don’t drink and boat”, “get your PCOC” and “wear your lifejacket” messages • 2012 awareness higher than earlier 2006-2008 levels for “get your PCOC” and “review your checklist” messages % of total boaters who are Aware of boating safety messages (n = 436) 2012Change vs2006-08 = = = = = = = 201040 37 32 19 17 12 14 17 13 200945 25 27 20 16 16 14 16 11 2008 39 18 25 17 11 12 10 11 9 2012 Don’t drink alcoholic beverages while boating… it’s that simple. If you drink, don’t drive. Everyone operating a motorized boat or water craft should get their Pleasure Craft Operator Card. Make the smart choice. Don’t just carry your lifejacket aboard your boat. Wear it. Watch the weather while out boating…keep a weather eye out. • Review your checklist before you go out on the water. Be prepared. • If you wear your lifejacket before falling into cold water you’ll float and have a chance to survive. • Have the right safety equipment on board your boat… have a flare for rescue. Be prepared for the possibility of falling into cold water by wearing your lifejacket. The more knowledge you have, the more enjoyable boating becomes. 41 27 27 22 19 16 15 14 11 1. Which of the following boating safety messages have you seen or heard during the last few weeks? (eg. on TV, radio, in newspapers, magazines, on-line, etc.)
Fishermen and Boat Drivers have highest awareness of “don’t drink & boat” message % of boating activity participants Aware of each boating safety message • Boat Drivers also have highest awareness of “get your PCOC” message and fishermen somewhat higher for lifejacket messages Total Boaters(436) Don’t drink alcoholic beverages while boating… it’s that simple. If you drink, don’t drive. Everyone operating a motorized boat or water craft should get their Pleasure Craft Operator Card. Make the smart choice. Don’t just carry your lifejacket aboard your boat. Wear it. Watch the weather while out boating…keep a weather eye out. • Review your checklist before you go out on the water. Be prepared. • If you wear your lifejacket before falling into cold water you’ll float and have a chance to survive. • Have the right safety equipment on board your boat… have a flare for rescue. Be prepared for the possibility of falling into cold water by wearing your lifejacket. The more knowledge you have, the more enjoyable boating becomes. 41 27 27 22 19 16 15 14 11 1. Which of the following boating safety messages have you seen or heard during the last few weeks? (eg. on TV, radio, in newspapers, magazines, on-line, etc.)
No significant changes in subgroups’ awareness of “don’t drink & boat” message in 2012 vs 2010 % of boaters aware of “don’t drink & boat” message 2009 42 37 52 52 45 46 59 39 56 3236 2010 36 40 37 48 43 37 37 3346 36 45 Age: 18-34 35-44* 45-54 55+ Gender: Male Female Region: Atlantic Quebec Ontario Prairies B.C. 2012 36 52 38 52 46 36 23 33 45 * Very small base size for 35-44 yrs in 2012 46 49 1. Which of the following boating safety messages have you seen or heard during the last few weeks? (eg. on TV, radio, in newspapers, magazines, on-line, etc.)
Highest awareness of “get your Pleasure Craft Operator Card” message in British Columbia and among older boaters 55+ yrs • Lower awareness of “get your PCOC” message in 2012 vs 2010 in Ontario, amongst women and 45+ yrs age groups. % of boaters aware of “get your PCOC” message 2009 19 20 32 32 24 28 21 37 26 1325 2010 23 41 41 48 39 34 21 4139 31 39 Age: 18-34 35-44* 45-54 55+ Gender: Male Female Region: Atlantic Quebec Ontario Prairies B.C. 2012 19 27 26 37 33 19 20 32 21 * Very small base size for 35-44 yrs in 2012 25 43 1. Which of the following boating safety messages have you seen or heard during the last few weeks? (eg. on TV, radio, in newspapers, magazines, on-line, etc.)
Highest awareness of “make the smart choice... wear your lifejacket” message in B.C. and amongst older boaters 55+ yrs; and lower in Atlantic Canada % of boaters aware of “make the smart choice… wear your lifejacket” message 2009 17 29 33 36 29 25 44 34 27 1423 2010 30 27 32 38 37 26 33 3230 31 38 Age: 18-34 35-44* 45-54 55+ Gender: Male Female Region: Atlantic Quebec Ontario Prairies B.C. 2012 23 18 22 38 31 22 13 28 24 * Very small base size for 35-44 yrs in 2012 31 37 1. Which of the following boating safety messages have you seen or heard during the last few weeks? (eg. on TV, radio, in newspapers, magazines, on-line, etc.)
No significant changes in subgroups awareness of “be prepared for possibility of falling into cold water by wearing your lifejacket” message in 2012 vs 2010 % of boaters aware of “be prepared for the possibility of falling into coldwater by wearing your lifejacket” message 2009 13 16 12 24 15 17 27 18 16 1115 2010 15 13 18 20 20 13 8 1718 18 15 Age: 18-34 35-44* 45-54 55+ Gender: Male Female Region: Atlantic Quebec Ontario Prairies B.C. 2012 14 7 11 20 17 12 10 10 15 * Very small base size for 35-44 yrs in 2012 13 23 1. Which of the following boating safety messages have you seen or heard during the last few weeks? (eg. on TV, radio, in newspapers, magazines, on-line, etc.)
High awareness of “if you wear your lifejacket before falling into cold water you’ll float and have a chance to survive” message amongst men and 55+ yrs % of boaters aware of “if you wear your lifejacket before falling into cold water you’ll float and have a chance to survive” message 2009 12 16 13 25 17 15 25 27 17 510 2010 9 8 13 18 15 10 8 179 13 13 Age: 18-34 35-44* 45-54 55+ Gender: Male Female Region: Atlantic Quebec Ontario Prairies B.C. 2012 14 22 11 27 21 10 12 18 13 * Very small base size for 35-44 yrs in 2012 19 23 1. Which of the following boating safety messages have you seen or heard during the last few weeks? (eg. on TV, radio, in newspapers, magazines, on-line, etc.)
Weaker PFD, cold water and boating education attitudes and behaviour in 2012; maintained position on drinking & boating and preparedness Desired Safe Boating Attitudes/Behaviours - % strongly agree they are doing or intend to do this year(top-2-box 9-10 rating on 10 pt scale) (n=436) 2012Change vs2008 = 2010 66 59 62 55 34 25 53 30 36 20 25 20 19 2012 2009 70 64 66 56 33 22 50 30 32 21 17 17 15 2008 65 66 68 n/a 40 n/a 59 n/a n/a 22 21 14 16 Drinking & boating:I am not going to drink any alcoholic beverages while out on the water in a boat this season Wearing your PFD:I will wear my PFD or lifejacket all the time when I’m out on the water in a boat this season I am going to strongly encourage everyone else who is out in a boat with me this season to wear their PFD or lifejacket, no matter what their age or swimming ability may be Preparedness:I will always check my boat over every time before I go out on the water this season; including making sure I have enough PFDs/lifejackets on board I’m going to review my pre-departure checklist, every time I go out on the water this season I have a pre-departure checklist written down that identifies the things to check every time before I head out on the water Cold water:I’m going to make a point of being better prepared for the possibility of falling into cold water this season, by wearing my lifejacket I don’t worry about the temperature of the water, as I don’t boat during what I consider to be the cold water season I feel that I am well prepared for the possibility of cold water immersion/ falling into cold water while out in a boat Boating education: I’m going to make a point of getting more information, or taking a course to learn more about how to boat safely I already have my Pleasure Craft Operator Card I don’t have my Pleasure Craft Operator Card yet, but I’m going to get it this year I have already taken boating safety education training beyond the PCOC level 61 54 55 50 29 25 43 34 24 12 25 12 13 3. Please indicate how much you agree or disagree that each of these statements applies to you, ie. describes things you are doing or intend to do this year (on a scale from 1[Strongly disagree] to 10[Strongly agree])
Anglers and powerboat passengers in particular have poorer PFD-wearing attitudes & behaviours in 2012 compared to 2010 Desired Safe Boating Attitudes/Behaviours - % strongly agree they are doing or intend to do this year(top-2-box 9-10 rating on 10 pt scale) (n=436) • Other boating subgroups maintained 3. Please indicate how much you agree or disagree that each of these statements applies to you, ie. describes things you are doing or intend to do this year (on a scale from 1[Strongly disagree] to 10[Strongly agree])
Weaker overall cold water attitudes reflect weaker attitudes in most boating activity sub-groups Desired Safe Boating Attitudes/Behaviours - % strongly agree they are doing or intend to do this year(top-2-box 9-10 rating on 10 pt scale) (n=436) Note: Arrows indicate significant changes in 2010 vs 2008 3. Please indicate how much you agree or disagree that each of these statements applies to you, ie. describes things you are doing or intend to do this year (on a scale from 1[Strongly disagree] to 10[Strongly agree])
More fishermen, boat drivers, passengers and canoeists/ kayakers say they have their PCOC in 2012 than in 2010 • Somewhat less intent to get more boating safety information/training among fishermen and canoeists/kayakers in 2012 than in 2010. Desired Safe Boating Attitudes/Behaviours - % strongly agree they are doing or intend to do this year(top-2-box 9-10 rating on 10 pt scale) (n=436) 3. Please indicate how much you agree or disagree that each of these statements applies to you, ie. describes things you are doing or intend to do this year (on a scale from 1[Strongly disagree] to 10[Strongly agree])
No significant changes in 2012 vs 2010 for “drinking & boating” nor “preparedness” attitudes & behaviours, by boating activity Desired Safe Boating Attitudes/Behaviours - % strongly agree they are doing or intend to do this year(top-2-box 9-10 rating on 10 pt scale) (n=436) Note: Arrows indicate significant changes in 2010 vs 2008 3. Please indicate how much you agree or disagree that each of these statements applies to you, ie. describes things you are doing or intend to do this year (on a scale from 1[Strongly disagree] to 10[Strongly agree])
Still evidence of stronger safe boating attitudes and behaviours amongst those aware of SBAW messages; although not as strong impact as in 2010 Desired Safe Boating Attitudes/Behaviours - % strongly agree they are doing or intend to do this year(top-2-box 9-10 rating on 10 pt scale) • In 2012, “drinking & boating” and “wearing your PFD” attitudes not positively affected by awareness of SBAW messages; whereas they were impacted in 2010. 3. Please indicate how much you agree or disagree that each of these statements applies to you, ie. describes things you are doing or intend to do this year (on a scale from 1[Strongly disagree] to 10[Strongly agree])
No significant changes from wave to wave, although slightly fewer boaters in 2010+2012 saying they “Always” wear a PFD, compared to 2008+2009 How often boaters say they wear a PFD/lifejacket% of total boaters (n=436) 15 10 3 47 25 12 7 2 52 27 56 24 6 3 11 55 26 11 6 1 Note: Arrows indicate significant changes in 2010 vs 2008 4. How often do you personally wear a PFD (“Personal Flotation Device”) or lifejacket when out in a boat?
Somewhat fewer younger, B.C. and Atlantic boaters “Always” wearing PFDs in 2010+12 than 2008+09 % of boaters in each sub-group who say they Always wear a PFD/lifejacket when out in a boat 2010+12Changevs 2008+09 2009 56 54 59 57 56 53 59 59 67 47 58 60 2010 52 46 54 52 56 48 56 59 56 48 55 45 2008 55 52 62 54 54 53 57 38 64 51 51 65 2012 Total boaters Age: 18-34 35-44* 45-54 55+ Gender: Male Female Region: Atlantic Quebec Ontario Prairies B.C. 47 41 28 53 50 46 49 65 44 45 49 * Very small base size for 35-44 yrs in 2012 47 4. How often do you personally wear a PFD (“Personal Flotation Device”) or lifejacket when out in a boat?
Less claimed wearing of PFDs in 2010+2012 than 2008+09 among powerboat passengers % of boating activity participants who saythey Always wear a PFD/lifejacket 2010+12Change vs2008+09 = = = = = = 2009 56 53 50 48 57 53 55 48 2008 55 53 48 49 55 41 52 47 2010 52 51 49 49 51 38 51 40 2012 Total boaters (436) Fishing (n=256) Pleasure powerboating(n=196) Drivers of powerboats (n=132) Passengers (only) (n=299) Ride PWC (n=35) Canoeing & Kayaking (n=188) Sailing (n=35) 47 49 43 44 47 50 46 46 4. How often do you personally wear a PFD (“Personal Flotation Device”) or lifejacket when out in a boat?
More belief in 2012 that “I can put PFD on if I need to” as a top reason boaters are not always wearing their PFD • Also more belief in 2010+2012 than 2008+09 that “it’s good enough to be a good swimmer“ as another top reason for not always wearing their PFD. Reasons for not Always wearing a PFD/lifejacket when out in a boat - % of boaters who do not always wear a PFD 5. Which if any of the following reasons describe why you do not always wear a PFD or lifejacket when boating?
Rough water or being out in a kayak are the conditions that most motivate boaters to wear their PFDs; followed by being out in a canoe or small sailboat • Little change since 2009 in how motivating these various factors are % of boaters who say they would Always wear a PFD/lifejacket out in a boat under the following conditions 2010+12Change vs2009 = = = = = = = = = = = = = Overall % of boaters who would always wear a PFD (before any conditions are mentioned) Water is…Rough (ie. can see white caps)CalmCold In an area…I am not familiar withI know very well Boat is…More than 50 feet from shoreClose to shore (within 50 feet)Under wayAnchored or drifting Out in a…KayakCanoeSmall sailboatSmall, open powerboat > 6 metres 2009 56 72 52 63 63 54 57 50 57 46 70 65 64 61 2010 52 75 51 63 66 54 60 49 58 42 71 65 66 61 2012(n=423) 47 70 48 60 60 51 55 45 56 43 69 64 63 58 7. How often do you personally wear a PFD or lifejacket when out in a boat, under each of the following specific conditions?
Positive impact on intent to wear PFDs evident for awareness of SBAW messages in both 2012 and 2010 • Slightly broader impact in 2012 than 2010 % of boaters who say they would Always wear a PFD/lifejacket out in a boat under the following conditions 7. How often do you personally wear a PFD or lifejacket when out in a boat, under each of the following specific conditions?
About one-third (36%) of boaters say they’ve heard messages about the risks of cold water • Higher cold water message awareness among older boaters 55+ years (54%), and boat drivers (54%) • Less evidence in 2012 than 2010 that those who have seen/heard cold water messages, have more positive cold water attitudes & intended behaviour % who strongly agree (top-2-box 9-10 on 10 pt scale) 2010 59 30 39 Safe boating cold water attitudes & behaviours:(% of boaters who strongly agree (top-2-box 9-10 on 10 pt scale) I’m going to make a point of being better prepared for the possibility of falling into cold water this season, by wearing my lifejacket I don’t worry about the temperature of the water, as I don’t boat during what I consider to be the cold water season I feel that I am well prepared for the possibility of cold water immersion/ falling into cold water while out in a boat 2012 48 Total Boaters 36%say they have seen/heard about the risks of cold water(40% in 2010) 30 27 boaters who have seen/heard about risks of cold water 9a. Have you seen or heard any communications/messages (for example in ads ,on posters, on websites, at events or training programs, etc.) about the risks associated with cold water, immersion/falling into cold water, either recently or any time in the past year? 3. Please indicate how much you agree or disagree that each of these statements applies to you, ie. describes things you are doing or intend to do this year (on a scale from 1[Strongly disagree] to 10[Strongly agree])
Less generation of awareness of cold water risks from boating safety organizations in 2012 than 2010 – ie. via their brochures/pamphlets and instructors • Somewhat more awareness generated by radio and outdoor/mall/transit media • Somewhat less recognition of hearing about cold water risks via news coverage/articles Sources for seeing/hearing about cold water risks Total Boaters 36%say they have seen/heard about the risks of cold water(40% in 2010) 9b. Which of the following are ways you have seen or heard about risks associated with cold water immersion or falling into cold water?
Demographic Profile & = significantly different from June 2010 results at 95% confidence level
Demographic Profile (cont’d) & = significantly different from June 2010 results at 95% confidence level
By age, weaker cold water attitudes overall trace especially to older boaters 55+ years and those 35-44 years Desired Safe Boating Attitudes/Behaviours - % strongly agree they are doing or intend to do this year(top-2-box 9-10 rating on 10 pt scale) (n=436) 3. Please indicate how much you agree or disagree that each of these statements applies to you, ie. describes things you are doing or intend to do this year (on a scale from 1[Strongly disagree] to 10[Strongly agree])
By age, lower overall PFD-wearing attitudes in 2012 than 2010 trace especially to older boaters 55+ years Desired Safe Boating Attitudes/Behaviours - % strongly agree they are doing or intend to do this year(top-2-box 9-10 rating on 10 pt scale) (n=436) 3. Please indicate how much you agree or disagree that each of these statements applies to you, ie. describes things you are doing or intend to do this year (on a scale from 1[Strongly disagree] to 10[Strongly agree])