Visualizing Mathematics: An Exploration of Random Visual Phenomena in Statistics and Geometry
This resource delves into the fascinating realm of visual mathematics, exploring various random mathematical phenomena through visual models. It covers topics such as the characteristics of triangles, including the space of all triangles defined by similarity, and examines how to represent these visually. Additionally, it features polynomial operations visualized, the sum of consecutive integers, and insights into the Pythagorean theorem and parabolas. Ideal for educators and students alike, this compilation aims to enrich understanding through visualization.

Visualizing Mathematics: An Exploration of Random Visual Phenomena in Statistics and Geometry
E N D
Presentation Transcript
Visualizing Mathematics:An Investigation of Random Visual Mathematical Phenomena and Somewhat Specifically UsingVisual Modelsin Statistics
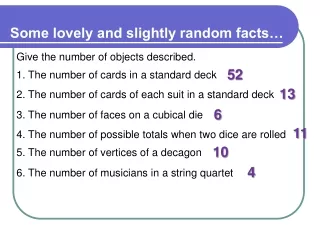
Some Random Visual Mathematical Phenomena • One Triangle to Rule Them All… • Matthew Peterson – Teaching Without Words • Multiplying/Dividing Polynomials Visually • The Sum of Consecutive Integers • Nets • Visual of Pythagorean Theorem • Playing With Parabolas • Visualizing Functions • Other Resources
One Triangle to Rule Them All… The space of all triangles To describe the space of all triangles, we will consider two triangles to be the same if they are similar. How much information do you need to know to describe a triangle, under this definition? How could you represent all the triangles visually?
Where are: • The degenerate triangles? • Right triangles? • Acute triangles? • Isosceles triangles? • Equilateral triangles? • Other questions to consider: • Is every triangle represented here? The space of all triangles
Matthew Peterson – Teaching Without Words • http://www.youtube.com/watch?v=2VLje8QRrwg (go to 4:41)
Multiplying/Dividing Polynomials Visually From www.billthelizard.com From www.mathrecreation.com
Multiplying/Dividing Polynomials Visually From www.mathrecreation.com
Visualizing Sums of… • http://www.billthelizard.com/2009/07/six-visual-proofs_25.html
Nets • http://www.senteacher.org/wk/3dshape.php
Visual of Pythagorean Theorem • See Geogebra
Playing With Parabolas • See Geogebra
Other Resources • See document
UsingVisual Models in Statistics • Handouts…