Download
1 / 20
200 likes | 367 Vues
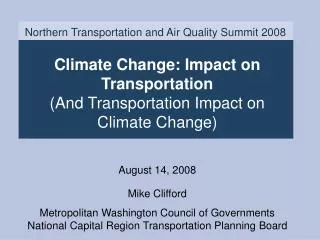
Northern Transportation and Air Quality Summit 2008. Climate Change: Impact on Transportation (And Transportation Impact on Climate Change) August 14, 2008 Mike Clifford Metropolitan Washington Council of Governments National Capital Region Transportation Planning Board. Presentation Outline.

E N D
Northern Transportation and Air Quality Summit 2008 Climate Change: Impact on Transportation(And Transportation Impact on Climate Change)August 14, 2008Mike CliffordMetropolitan Washington Council of GovernmentsNational Capital Region Transportation Planning Board
Presentation Outline • Introduction/Background • Planning Context for Greenhouse Gas (GHG) Emissions • Emissions Reduction Analysis • Next Steps
I. Introduction/Background Climate change initiative Formation of Steering Committee (CCSC) in April 2007 Led to TPB’s involvement Similar to SIP responsibilities: • Inventory construction for mobile source GHG emissions • Analysis of emissions reduction measures and strategies CCSC completed its charge Draft report now out for agency and public comment through Sept. 30
II. Planning Context • Inputs • Geography: 8-hour ozone non-attainment area • Analysis years: 1990-2030 • Technical Process • Travel demand forecasting • Mobile 6 emissions factors • CO2 yearly totals (tons/yr), CO2e • Initial Results • By source • Mobile emissions through time
Annual Mobile CO2 Emissions (Tons) for 8-Hour Ozone Non-Attainment Area Note: Years 2000, 2005 and 2020 were interpolated using 2002, 2010 and 2030 emissions estimates from the October 18, 2006 conformity determination.
2002-2030 Changes in Employment, Households, VMT, NOx, VOC and CO2for the 8-Hour Ozone Non-Attainment Area
III. Planning for Emissions Reductions • Targets (from CCSC) • By 2012: reduce to 2005 levels • By 2020: reduce to 20% below 2005 levels • By 2050: reduce to 80% below 2005 levels • Processes • CCSC draft report represents research effort • TPB Scenario Study Task Force: “What Would it Take?”
III. Planning for Emissions Reductions, cont’d • Transportation Measures • Committed (CAFE, TERMs) • Analyze strategies (fuel efficiency, carbon intensity, vehicle travel reductions including land use, travel behavior/system performance and travel pricing) • Development of Reductions Strategy • Cost-effectiveness approach • McKinsey Report • May 2, 2008 memo to TPB Technical Committee • Scale of benefits
Building the “What Would it Take?” Scenario Three categories of strategies to reduce mobile CO2 emissions Fuel Efficiency Fuel Carbon Intensity Travel Efficiency Reduce VMT through changes in land use, travel behavior, prices Reduce congestion Improve operational efficiency Beyond CAFE standards [currently 35 mpg by 2020] Alternative fuels (biofuels, hydrogen, electricity) Vehicle technology (hybrid engine technology)
What Would it Take with Fuel Efficiency? Fuel Efficiency Beyond CAFE standards [currently 35 mpg by 2020]
What Would it Take with Alternative Fuels? Fuel Carbon Intensity Alternative fuels (biofuels, hydrogen, electricity) Vehicle technology (hybrid engine technology) How would this look with lifecycle emissions for the region?
What Would it Take with VMT? Travel Efficiency Reduce VMT through changes in land use, travel behavior, prices Reduce congestion Improve operational efficiency
What Can We Do by Reducing Congestion? Travel Efficiency Reduce VMT through changes in land use, travel behavior, prices Reduce congestion Improve operational efficiency Source: University of California, Riverside
Analyzing Cost-Effectiveness Initial analysis of cost-effectiveness of Transportation Emissions Reduction Measures ($ per ton of CO2 reduced)
IV. Next Steps EPA’s Proposed Rulemaking Comment upon Federal direction CCSC report Continuing research effort once report is finalized TPB Scenario Study Ongoing study effort of mobile sources through June 30, 2009
Reference/Contact Information CCSC Report http://www.mwcog.org/environment/climate/about.asp TPB Scenario Study http://www.mwcog.org/transportation/committee/committee/default.asp?COMMITTEE_ID=230 Mike Clifford, mclifford@mwcog.org