Download

1 / 28
290 likes | 524 Vues
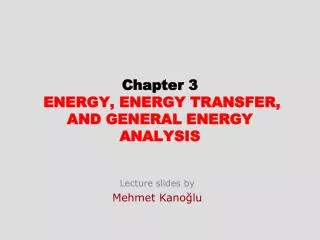
Chapter 13 Biological Productivity and Energy Transfer. Essentials of Oceanography 7 th Edition. Primary productivity. Primary productivity is the amount of carbon (organic matter) produced by organisms Mostly through photosynthesis Energy source = solar radiation

E N D
Chapter 13 Biological Productivity and Energy Transfer Essentials of Oceanography 7th Edition
Primary productivity • Primary productivity is the amount of carbon (organic matter) produced by organisms • Mostly through photosynthesis • Energy source = solar radiation • Also includes chemosynthesis • Energy source = chemical reactions
Photosynthetic productivity Figure 13-1
Oceanic photosynthetic productivity • Controlling factors affecting photosynthetic productivity: • Availability of nutrients • Nitrates • Phosphates • Iron • Amount of sunlight • Varies daily and seasonally • Sunlight strong enough to support photosynthesis occurs only to a depth of 100 meters (euphotic zone)
Locations of maximum photosynthetic productivity • Margins of the oceans • Abundant supply of nutrients from land • Water shallow enough for light to penetrate all the way to the sea floor • Upwelling areas • Currents hoist cool, nutrient-rich deep water to the sunlit surface
Coastal upwelling Figure 13-3
The electromagnetic spectrum and light penetration in seawater Figure 13-4
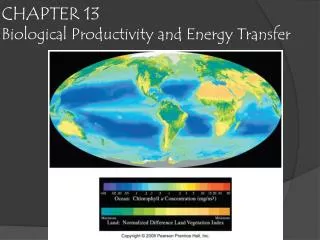
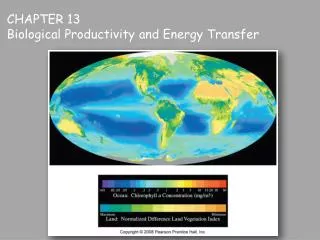
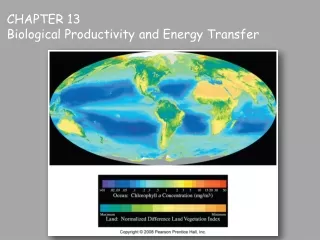
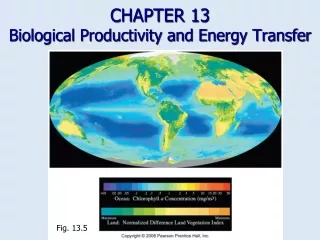
Water color and life in the ocean • Ocean color is influenced by: • The amount of turbidity from runoff • The amount of photosynthetic pigment, which corresponds to the amount of productivity • Yellow-green = highly productive water • Found in coastal and upwelling areas (eutrophic) • Clear indigo blue = low productivity water • Found in the tropics and open ocean (oligotrophic)
Satellite view of world productivity Figure 13-6
Photosynthetic marine organisms: Plants • Seed-bearing plants • Eelgrass (Zostera) • Surf grass (Phyllospadix) Surf grass Figure 13-7
Photosynthetic marine organisms: Macroscopic algae • Brown algae • Sargassum (top left) • Macrocystis (top right) • Green algae • Codium (bottom left) • Red algae • Lithothamnion (bottom right) Figure 13-8
Photosynthetic marine organisms: Microscopic algae • Microscopic algae include: • Golden algae • Diatoms (silica test resembles a pillbox) • Coccolithophores (calcite plates form a spherical test) • Dinoflagellates • Produce a test made of keratin • Posses a whip-like flagella • Bioluminescence • Exist in great abundance, creating red tides (harmful algae blooms)
Dinoflagellates and red tides Figure 13C
Regional productivity • Photosynthetic productivity varies due to: • Amount of sunlight • Availability of nutrients • Thermocline (a layer of rapidly changing temperature) limits nutrient supply • Examine three open ocean regions: • Polar oceans (>60° latitude) • Tropical oceans (<30° latitude) • Temperate oceans (30-60° latitude)
Productivity in polar oceans • Sunlight peaks in summer • Nutrients available nearly year-round (only weak seasonal thermocline develops) • Productivity: • Peaks in spring • Limited by sunlight Figure 13-10a
Productivity in tropical oceans • Sunlight strong year-round • Nutrients limited by strong, permanent thermocline • Productivity: • Steady, low rate • Limited by nutrients • Exceptions: • Upwelling areas • Coral reefs Figure 13-11
Productivity in temperate oceans • Sunlight varies seasonally • Nutrients limited by thermocline • Productivity: • Spring bloom limited by nutrients • Fall bloom limited by sunlight Figure 13-12
Productivity in tropical, temperate, and polar oceans Figure 13-13
Energy flow in marine ecosystems • Categories of organisms: • Producers • Consumers • Decomposers Figure 13-14
Biogeochemical cycling of matter Figure 13-16
Ecosystem energy flow and efficiency • Energy is passed between trophic (feeding) levels • Transfer efficiencies: • Algae = 2% • Other levels = 10% Figure 13-18
Comparison between a food chain and a food web Figure 13-19
Biomass pyramid • At each step up the pyramid, there is/are: • Larger organisms • Fewer individuals • A smaller total biomass Figure 13-20
Ecosystems and fisheries • Fishery = fish caught from the ocean by commercial fishers • Largest proportion of marine fish are taken from shallow shelf and coastal waters Figure 13-21
Fisheries and overfishing • World total marine fish production has increased dramatically • Overfishing occurs when adult fish are harvested faster than their natural rate of reproduction Figure 13-22
Fisheries and bycatch • Some fishing practices produce large amounts of incidental catch (bycatch): • Purse seine nets set for tuna can trap dolphins • Driftnets (gill nets) take many unwanted species Spotted dolphin Figure 13-23
Fisheries management • Fisheries management seeks to maintain a long-term fishery by: • Assessing ecosystem health • Determining fish stocks • Analyzing fishing practices • Enforcing catch limits • Fisheries management does not regulate the number of fishing vessels Figure 13-25
End of Chapter 13 Essentials of Oceanography 7th Edition