Download
1 / 49
490 likes | 721 Vues
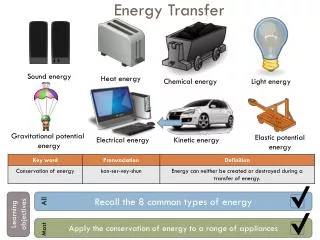
An Introduction to Metabolism. Energy and Energy transfer. Overview. Metabolism Exothermic/Endothermic reactions ATP Energy pyramids and ecosystems. Overview: The Energy of Life The living cell Is a miniature factory where thousands of reactions occur Converts energy in many ways.

E N D
An Introduction to Metabolism Energy and Energy transfer
Overview • Metabolism • Exothermic/Endothermic reactions • ATP • Energy pyramids and ecosystems
Overview: The Energy of Life • The living cell • Is a miniature factory where thousands of reactions occur • Converts energy in many ways
Metabolism • Is the totality of an organism’s chemical reactions • Arises from interactions between molecules
Enzyme 1 Enzyme 2 Enzyme 3 A D C B Reaction 1 Reaction 2 Reaction 3 Startingmolecule Product Organization of the Chemistry of Life into Metabolic Pathways • A metabolic pathway has many steps • That begin with a specific molecule and end with a product • That are each catalyzed by a specific enzyme
Catabolic pathways • Break down complex molecules into simpler compounds • Release energy • Anabolic pathways • Build complicated molecules from simpler ones • Consume energy
Thermodynamics • Is the study of energy transformations An organism’s metabolism transforms matter and energy, subject to the laws of thermodynamics
The First and Second Laws of Thermodynamics • According to the first law of thermodynamics • Energy can be transferred and transformed • Energy cannot be created or destroyed • According to the second law of thermodynamics • Spontaneous changes that do not require outside energy increase the entropy, or disorder, of the universe
Concept 8.2: The free-energy change of a reaction tells us whether the reaction occurs spontaneously
Free-Energy Change, G • A living system’s free energy • Is energy that can do work under cellular conditions • The change in free energy, ∆Gduring a biological process • Is related directly to the enthalpy change (∆H) and the change in entropy • ∆G = ∆H – T∆S
Free Energy, Stability, and Equilibrium • Organisms live at the expense of free energy • During a spontaneous change • Free energy decreases and the stability of a system increases
Reactants Amount of energy released (∆G <0) Free energy Energy Products Progress of the reaction Figure 8.6 (a) Exergonic reaction: energy released Exergonic and Endergonic Reactions in Metabolism • An exergonic reaction • Proceeds with a net release of free energy and is spontaneous
Products Amount of energy released (∆G>0) Free energy Energy Reactants Progress of the reaction Figure 8.6 (b) Endergonic reaction: energy required • An endergonic reaction • Is one that absorbs free energy from its surroundings and is nonspontaneous
∆G < 0 ∆G = 0 (a) A closed hydroelectric system. Water flowing downhill turns a turbine that drives a generator providing electricity to a light bulb, but only until the system reaches equilibrium. Figure 8.7 A Equilibrium and Metabolism • Reactions in a closed system • Eventually reach equilibrium
(b) An open hydroelectric system. Flowing water keeps driving the generator because intake and outflow of water keep the system from reaching equlibrium. ∆G < 0 Figure 8.7 • Cells in our body • Experience a constant flow of materials in and out, preventing metabolic pathways from reaching equilibrium
∆G < 0 ∆G < 0 ∆G < 0 (c) A multistep open hydroelectric system. Cellular respiration is analogous to this system: Glucoce is brocken down in a series of exergonic reactions that power the work of the cell. The product of each reaction becomes the reactant for the next, so no reaction reaches equilibrium. Figure 8.7 • An analogy for cellular respiration
Concept 8.3: ATP powers cellular work by coupling exergonic reactions to endergonic reactions • A cell does three main kinds of work • Mechanical • Transport • Chemical
Adenine NH2 C N C N HC O O O CH C N - N O O O O CH2 O - - - O O O H H Phosphate groups H H Ribose Figure 8.8 OH OH The Structure and Hydrolysis of ATP • ATP (adenosine triphosphate) • Is the cell’s energy shuttle • Provides energy for cellular functions
Structure of ATP • Phosphate – phosphate bonds • Negative charges repel, unstable • “high transferable energy” • C-C ~400 KJ/mol while P-P 7.3 KJ/mol • Right amount for most chemical reactions • Each cell contains one billion ATP • Short term storage • Controlled production
P P P Adenosine triphosphate (ATP) H2O Energy + P i P P Adenosine diphosphate (ADP) Inorganic phosphate Figure 8.9 • Energy is released from ATP • When the terminal phosphate bond is broken
P i P Motor protein Protein moved (a) Mechanical work: ATP phosphorylates motor proteins Membrane protein ADP + ATP P i P P i Solute Solute transported (b) Transport work: ATP phosphorylates transport proteins P NH2 + + NH3 P i Glu Glu Reactants: Glutamic acid and ammonia Product (glutamine) made Figure 8.11 (c) Chemical work: ATP phosphorylates key reactants • The three types of cellular work • Are powered by the hydrolysis of ATP
ATP hydrolysis to ADP + P i yields energy ATP synthesis from ADP + P i requires energy ATP Energy from catabolism (exergonic, energy yielding processes) Energy for cellular work (endergonic, energy- consuming processes) ADP + P i Figure 8.12 The Regeneration of ATP • Catabolic pathways • Drive the regeneration of ATP from ADP and phosphate
Concept 8.4: Enzymes speed up metabolic reactions by lowering energy barriers • A catalyst • Is a chemical agent that speeds up a reaction without being consumed by the reaction
An enzyme • Is a catalytic protein
The activation energy, EA • Is the initial amount of energy needed to start a chemical reaction • Is often supplied in the form of heat from the surroundings in a system
Course of reaction without enzyme EA without enzyme EA with enzyme is lower Reactants Free energy ∆G is unaffected by enzyme Course of reaction with enzyme Products Progress of the reaction Figure 8.15 • The effect of enzymes on reaction rate
The active site can lower an EA barrier by • Orienting substrates correctly • Straining substrate bonds • Providing a favorable microenvironment • Covalently bonding to the substrate
Concept 8.5: Regulation of enzyme activity helps control metabolism • A cell’s metabolic pathways • Must be tightly regulated
Light energy ECOSYSTEM Photosynthesisin chloroplasts Organicmolecules CO2 + H2O + O2 Cellular respirationin mitochondria ATP powers most cellular work Heatenergy Figure 9.2 • Energy • Flows into an ecosystem as sunlight and leaves as heat
Products Reactants becomes oxidized + + + Energy 2O2 CO2 2 H2O CH4 becomes reduced H C C O O O O H O H H H H Oxygen(oxidizingagent) Methane(reducingagent) Carbon dioxide Water Figure 9.3 • Some redox reactions • Do not completely exchange electrons • Change the degree of electron sharing in covalent bonds
becomes oxidized C6H12O6 + 6O2 6CO2 + 6H2O + Energy becomes reduced Oxidation of Organic Fuel Molecules During Cellular Respiration • During cellular respiration • Glucose is oxidized in a series of steps and oxygen is reduced
2 e– + 2 H+ 2 e– + H+ NAD+ NADH H Dehydrogenase O O H H Reduction of NAD+ + + 2[H] C NH2 NH2 C (from food) Oxidation of NADH N N+ Nicotinamide(reduced form) Nicotinamide(oxidized form) CH2 O O O O– P O H H OH O O– HO P NH2 HO CH2 O N N H N H N O H H HO OH Figure 9.4 • Electrons from organic compounds • Are usually first transferred to NAD+, a coenzyme
NADH, the reduced form of NAD+ • Passes the electrons to the electron transport chain • At the end of the chain • Electrons are passed to oxygen, forming water
Electron shuttles span membrane MITOCHONDRION CYTOSOL 2 NADH or 2 FADH2 2 FADH2 2 NADH 2 NADH 6 NADH Glycolysis Oxidative phosphorylation: electron transport and chemiosmosis Citric acid cycle 2 Acetyl CoA 2 Pyruvate Glucose + 2 ATP + 2 ATP + about 32 or 34 ATP by oxidative phosphorylation, depending on which shuttle transports electrons from NADH in cytosol by substrate-level phosphorylation by substrate-level phosphorylation About 36 or 38 ATP Maximum per glucose: Figure 9.16 • There are three main processes in this metabolic enterprise
Excited state e– Heat Energy of election Photon (fluorescence) Ground state Chlorophyll molecule Photon Figure 10.11 A Excitation of Chlorophyll by Light • When a pigment absorbs light • It goes from a ground state to an excited state, which is unstable
H2O CO2 Light NADP+ ADP CALVIN CYCLE LIGHT REACTIONS ATP NADPH Electron Transport chain O2 [CH2O] (sugar) Primary acceptor 7 Primary acceptor 4 Fd Electron transport chain Pq 2 e 8 e– e H2O NADP+ + 2 H+ Cytochrome complex 2 H+ NADP+ reductase + 3 NADPH O2 PC e– + H+ P700 e– 5 Light P680 Light 1 6 ATP Photosystem-I (PS I) Photosystem II (PS II) Figure 10.13 • Produces NADPH, ATP, and oxygen
A Comparison of Chemiosmosis in Chloroplasts and Mitochondria • Chloroplasts and mitochondria • Generate ATP by the same basic mechanism: chemiosmosis • But use different sources of energy to accomplish this
Concept 10.3: The Calvin cycle uses ATP and NADPH to convert CO2 to sugar • The Calvin cycle • Is similar to the citric acid cycle • Occurs in the stroma
H2O Input CO2 Light 3 (Entering one at a time) NADP+ CO2 ADP CALVINCYCLE LIGHTREACTION ATP NADPH Rubisco O2 [CH2O] (sugar) 3 P P Short-livedintermediate P 6 3 P P Ribulose bisphosphate(RuBP) 3-Phosphoglycerate 6 ATP 6 ADP CALVIN CYCLE 3 ADP 6 P P 3 ATP 1,3-Bisphoglycerate 6 NADPH 6 NADPH+ 6 P P 5 (G3P) 6 P Glyceraldehyde-3-phosphate (G3P) P 1 Glucose andother organiccompounds G3P(a sugar)Output Figure 10.18 • The Calvin cycle Phase 1: Carbon fixation Phase 3:Regeneration ofthe CO2 acceptor(RuBP) Phase 2:Reduction
Overview: Ecosystems, Energy, and Matter • An ecosystem consists of all the organisms living in a community • As well as all the abiotic factors with which they interact
Concept 54.1: Ecosystem ecology emphasizes energy flow and chemical cycling • Ecosystem ecologists view ecosystems • As transformers of energy and processors of matter
Ecosystems and Physical Laws • The laws of physics and chemistry apply to ecosystems • Particularly in regard to the flow of energy • Energy is conserved • But degraded to heat during ecosystem processes
Tertiary consumers Microorganisms and other detritivores Secondary consumers Primary consumers Detritus Primary producers Heat Key Chemical cycling Sun Energy flow Figure 54.2 • Energy flows through an ecosystem • Entering as light and exiting as heat
Concept 54.2: Physical and chemical factors limit primary production in ecosystems • Primary production in an ecosystem • Is the amount of light energy converted to chemical energy by autotrophs during a given time period • The extent of photosynthetic production • Sets the spending limit for the energy budget of the entire ecosystem
Gross and Net Primary Production • Total primary production in an ecosystem • Is known as that ecosystem’s gross primary production (GPP) • Not all of this production • Is stored as organic material in the growing plants • Net primary production (NPP) • Is equal to GPP minus the energy used by the primary producers for respiration • Only NPP • Is available to consumers
Tertiary consumers 10 J Secondary consumers 100 J Primary consumers 1,000 J Primary producers 10,000 J Figure 54.11 1,000,000 J of sunlight Pyramids of Production • This loss of energy with each transfer in a food chain • Can be represented by a pyramid of net production
Trophic level Number of individual organisms Tertiary consumers 3 Secondary consumers 354,904 Primary consumers 708,624 Primary producers 5,842,424 Figure 54.13 Pyramids of Numbers • A pyramid of numbers • Represents the number of individual organisms in each trophic level
Trophic level Secondary consumers Primary consumers Primary producers • Worldwide agriculture could successfully feed many more people • If humans all fed more efficiently, eating only plant material Figure 54.14
Herring gull eggs 124 ppm Lake trout 4.83 ppm Concentration of PCBs Smelt 1.04 ppm Zooplankton 0.123 ppm Phytoplankton 0.025 ppm Figure 54.23 • In biological magnification • Toxins concentrate at higher trophic levels because at these levels biomass tends to be lower