Download
1 / 42
420 likes | 565 Vues
Regional Science Update Southern Africa Agricultural Drought: New Directions in Risk Assessment, Monitoring & Forecasting Tamuka Magadzire. Outline. Research and analyses supporting FEWSNET analytical approach Capacity building. Research & analyses.

E N D
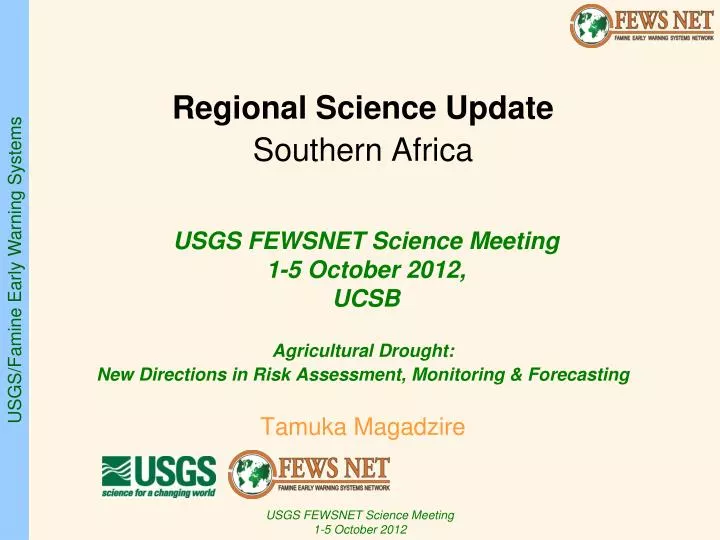
Regional Science Update Southern Africa Agricultural Drought: New Directions in Risk Assessment, Monitoring & Forecasting Tamuka Magadzire
Outline • Research and analyses supporting FEWSNET analytical approach • Capacity building
Research & analyses • Use of COF products for guidance and scenario devpt • Forecast interpretation in southern Africa • Historical COF performance analysis • Other potentially useful forecast products • SOS forecasting • Building a knowledge base to better understand climatic influences on agriculture • SOS variability analysis to better understand SOS • El Nino historical rainfall analysis
Research & analyses Use of COF products for guidance and scenario devpt Forecast interpretation in southern Africa Historical COF performance analysis
Forecast interpretation • Quantitive analysis of COF forecasts (FIT) does not work in southern Africa • Forecasts almost always some 25/35/40 combimnation • FIT results always very close to climatology, downstream analyses don’t vary
Forecast interpretation • As a result, in last few seasons, have tried various quantitative interpretations, including: • Simplifying forecast to remove unnecessary information • Unpacking potential impacts of early season (OND) and late season (JFM) forecasts • Combining OND and JFM analyses • Explaining potential impacts in context of previous seasonal outcomes • Explaining potential impacts in context of current inferred soil moisture conditions • Incorporating information from other forecast centres and better understood climatic phenomenon • Explaining in depth the concepts of potential, likely and alternative outcomes (scenarios) embedded in the forecast
Forecast interpretation • Further thoughts • Observed at last SARCOF that most users only consider highest tercile – “rainfall is going to be above normal, therefore…” • Science issue?: develop guidance and tools to help users better apply forecast (e.g., hedging etc), including alternate outcomes • Forecast interpretation is insufficient for good scenario development, and other forecast products required: dry spells, SOS, weighted analog years analyses. ** NOAA; UCSB; IRI
Historical COF performance • To independently answer the question • How good are our regional forecasts • How well have they performed in the past • Can we trust them for our scenarios analysis, or should we more heavily weight other forecasts • Result: Despite limited utility in qualitative analysis, SARCOF has generally provided good guidance in the past
Historical COF performance • Independent evaluation process was developed • Minimizes the advantages of “hedging” (Mason and Chidzambwa, 2008) • Considers potential user interpretation to define a “good” or “poor” forecast • Verifies using terciles not percentages • Used 2001 to 2011 RFE data
With hedging • Both forecasts score a half-hit, yet from user perspective, Forecast B much better than Forecast A
Forecast performance OND JFM Percentage number of times a “good” forecast was given between 2001 and 2012
Forecast performance OND JFM Percentage number of times a “poor” forecast was given between 2001 and 2012
Forecast performance • Further thoughts: • Engage with forecasting community to increase the confidence they express in their forecasts (not 25/40/35) • Verify validation technique with forecasting partners: NOAA, IRI
Research & analyses Other potentially useful forecast products SOS forecasting
SOS forecasting • Background • SOS forecast using similar methodologies used at COF (linear regression) • Forecasting tools developed after attending one COF highlighted the need for improved automation and data handling • New processing chain cuts down process of developing forecasts from +/-10 days to < 1 day • Can theoretically forecast various parameters including SOS • SOS forecast can potentially assist in scenario building
Final Results – alternative representation 95% Confidence Interval Model Estimate 95% Confidence Interval Lower Limit Upper Limit
SOS forecasting • Actual outcomes
SOS forecasting • Further thoughts • Method shows some potential for use, needs further verification for performance and accuracy (e.g. hindcasting) • Further development through forecast partners; other intraseasonal forecast products – dry spells, WRSI… NOAA; USGS; UCSB; IRI • Was used in SADC agromet report last season and quoted as “preliminary results from experimental models”, and was in agreement with SARCOF product
Research & analyses Building a knowledge base to better understand climatic influences on agriculture SOS variability analysis to better understand SOS El Nino historical rainfall analysis
SOS variability analysis • An SOS variability analysis was undertaken just before the beginning of last season in order to better understand SOS, and therefore better inform scenario building. • Using 2001/2002 to 2010/2011 RFE SOS data • Assumption: areas with a higher variability in SOS have higher fluctuations less reliability in the start of season more late onsets more reduced crop growing windows more frequent negative impacts on expected yields
SOS variability analysis Median SOS Std Dev of SOS (in dekads)
SOS variability analysis – further thoughts • Areas with higher variability tend to be the more marginal areas, as far as crop production is concerned, particularly in southern Mozambique, southern Zimbabwe, and central Tanzania. • The SOS variability analysis can be a useful addition to a country/region’s knowledgebase • Further work to integrate into working country knowledbases; identify related required analyses
El Nino historical rainfall analysis • Carried out analysis of rainfall during over 40 year period between 1971 and 2010, focusing on 13 El Nino seasons during this time • # Challenge: • Availability of consistent, high quality data over the region • Used Univ. of Delaware 110 year dataset, which also has significant temporal and spatial gaps. • ** Looking forward to new FEWSNET climatic dataset • Some definitions • El Nino season: Season in which average sea surface temperature (SST) anomaly over Nino 3.4 region >= +0.5 for 5 consecutive 3-month average moving windows (TMAMW) • Weak El Nino: SST anomaly between 0.5 to 0.9 for at least 3 TMAMWs • Moderate El Nino: SST anomaly between 1.0 to 1.4 for at least 3 TMAMWs • Strong El Nino: SST anomaly >= 1.5 for at least 3 TMAMWs • Allowance made for borderline strength El Ninos • Multiple-season El Nino events split up and categorized season by season
El Nino historical rainfall analysis • El Niño has potential for impacting rainfall, particularly southward of the 10o South Latitude. • Rainfall response to El Niño, mainly reduction in rainfall, varies in space, • can generalize the impacts over wide areas to capture regional conditions • not all locations in the region are subject to the influence of the El Niño phenomenon • Analysis focused on JFM rainfall, during which critical crop development occurs in many areas • Frequency of below average rainfall increases during El Niño events in many areas, in areas 60 to 80% of time.
(a) percentage of the last 13 El Niño seasons that received less than 75% of the long term average January-February-March (JFM) rainfall total. (b) The percentage of all seasons between 1971 and 2010 that received less than 75% of average JFM rainfall (a) (b)
El Nino historical rainfall analysis • Identified areas prone to dry spells, and are more likely during El Niño events in many areas, • The strength of rank-ordered El Niño events (weak, moderate, or strong El Niño events) correlates well with reduced rainfall in a few areas • Significant variation from season to season for any given El Niño strength, though some areas had consistently below average rainfall performance during strong and moderate El Ninos • Analysis of weak and moderate El Nino events indicates moderate El Nino events have been more consistently associated with negative rainfall deficits, weak El Ninos have had a less consistent impact
(a) (b) • (a) Percent of all seasons that experienced at least 1 dry month between JFM (excludes dry areas) (b) change in percentage of dry spells that occur when considering all seasons vs El Niño seasons only
Percent occurrence of less than 75% of normal rainfall during 4 WEAK El Nino JFMs Percent occurrence of less than 75% of normal rainfall during 5 MODERATE El Nino JFMs
El Nino historical rainfall analysis • Further Thoughts: Despite the observations made in this analysis regarding potential impacts of El Niño events, it does not preclude the possibility that future El Niño events may behave differently than those observed • Key Question • 1: What could be the impacts of climate change on observed response of rainfall patterns to well known phenomenon such as El Nino • Implications on forecasting, identification an use of analog years etc • 2: Which other known whether patterns can be similarly analyzed to better quantify potential seasonal outcomes early on. Forecasting partners
Capacity building and analytical tools • GeoWRSI Improvements • Training activities & Operational usage • Remote monitoring possibilities
GeoWRSI – improvements • Transition to version 3; • New intuitive icon-based menu • Accessible local-calibration functions • Pentads • Forward/backward analysis • Less bugs • Currently implemented; not released • Better integration with ArcGIS • Improvements Easier setup/use Wider usage
Training Activities - In-country Capacity Building MW Dekadal Report • Activity • Agromet Training in: • production of improved rainfall estimates • seasonal monitoring using rainfall analysis and water balance modeling • crop yield estimation MZ Dekadal Report ZM Dekadal Report • Trainees: • Meteorology Dept • Min. of Agriculture • FEWSNET ZW Assessmt Report • Results: • more accurate, more timely information available to FEWSNET community FEWSNET Monitoring Tools being operationally run and reported on in Malawi, Mozambique, Zambia, Zimbabwe
Remote Monitoring possibilities • Ease of setting up GeoWRSI in new regions provides potential for RM • Recent experience with Malawi partner seconded to Timor Leste • Partners prepared base datasets • GeoWRSI set up for Timor Leste completed in 4 hours, with data available
Capacity Building • Further thoughts • Analytic tools like GeoWRSI can be used to provide capacity and help provide answers reqd by national partners; provide support for remote monitoring • Utilities required for quickly converting soil maps into Water Holding Capacity. USGS; USDA
Capacity Building • Further thoughts (cont) • Demand driven: A real need has been expressed for capacitating agromet instiutions in the region and around the world. High level managers involved • e.g. A Univ in Tanzania has committed to fund a GeoWRSI training for their national partners • More documentation required (v3 only doc only in Spanish). Can be independent documenter • What increases tool utility: Capturing the spectrum • Tool simplification means more usage • Advanced analytical modules engage advanced users • ** Further programming and GUI improvement would help
Summary Advances in support of key FEWSNET analytical approaches • Use of COF products for guidance and scenario devpt • Forecast interpretation in southern Africa • Historical COF performance analysis • Other potentially useful forecast products • SOS forecasting • Building a knowledge base to better understand climatic influences on agriculture • SOS variability analysis to better understand SOS • El Nino historical rainfall analysis • Capacity building and analytical tools • Training activities & Operational usage • Remote monitoring possibilities