APA Upper-Midwest Four State Conference
390 likes | 588 Vues
APA Upper-Midwest Four State Conference. October 4, 2006. Center for Transit-Oriented Development. Create a national marketplace for TOD, working with cities, transit agencies, developers, investors and communities.

APA Upper-Midwest Four State Conference
E N D
Presentation Transcript
APA Upper-Midwest Four State Conference October 4, 2006
Center for Transit-Oriented Development • Create a national marketplace for TOD, working with cities, transit agencies, developers, investors and communities. • A collaboration with Reconnecting America, The Center for Neighborhood Technology, Strategic Economics, and real estate and transit experts • Performing joint research effort funded by FTA and HUD to look at linkage between TOD and affordable housing http://www.reconnectingamerica.org
Overview • What is the H+T Affordability Index? • Why / Purpose • How does it work: Model Mechanics and Background • Who: Potential Applications • When: Project Timeline and Index Availability
H+T Affordability Index Equation H+T Index = (Housing Costs + Transportation Costs) Income What is the Housing + Transportation Affordability Index? • A tool to measure the 2 largest household costs – housing and transportation – by neighborhood. By measuring these costs, the H+T Affordability Index is also measuring the quality, attractiveness, and convenience, of the neighborhod.
Urban Market Decisions: Industry Roundtables • Commercial Retail Development (ICSC) • Credit Scoring for Small Business (ICIC) • LMI Online Consumer Preferences (One Econ) Why: The Power of Information Brookings Urban Markets and Living Cities Initiatives Healthy Urban Commun- ities Actionable Knowledge Urban Market Actors Data Reporters Collection Agencies Information Analysts Access Tools • Pilot Projects: Information Innovations to Spur Markets at Local Level • Housing/Transportation Affordability Index • PAID-Using Utility Payments to Bolster Credit Scores • Map/Analysis/Action on Correlates of Neighborhood Decline and Resurgence • Intelligent Middleware to Understand Urban Markets • Dec Support Tools for Urban Real Estate Markets • PPND: Pittsburgh Community Info System • Federal/State Urban Information Policy • NICS: Infrastructure for Community Statistics • Specific data issues of interest to urban markets: • ACS, GMP, LED • Monitor surveys and data collection activities • Scan federal urban data/informationissues UMI Program Areas/Activities
Why: To Understand affordability, its impacts, and potential solutions • Since at least 1984, Housing and Transportation have been the 2 largest household costs– consuming at least 50% of income for the average household
Why: To Understand affordability, its impacts, and potential solutions • The more households spend on housing and transportation, the less they have to spend on: • Savings • Education • Healthcare- preventive and acute • Entertainment • Retail and other goods in the local economy • If we can define the reasons for high neighborhood transportation costs, we can understand: • What to build? • Where to build, and where to live? • Who benefits?
What drives H+T Costs? • We know housing costs and what drives them: • Location, location, location; and • Housing size, construction, materials, amenities; and • Fees, taxes • What about transportation costs? ….It’s more than the price at the pump or the price of the car: • Location, location, location; and • Car costs, annual miles, gasoline costs, transit fares • Household size and income But total transportation costs by location are not reported ...until now
Photo Credit: NorthstarTrain.org What about Location? • Transportation costs vary by place, depending on: • Access to services • Walkable destinations • Extent and frequency of transit • Access to jobs • Density • Households who live in “location efficient” neighborhoods—regardless of size and income— • “own fewer vehicles and drive fewer miles, and therefore have lower transportation costs” (Location Efficiency Study. CNT, STPP, NRDC, 2000)
Can be adjusted to current prices, fares, auto types 7 Neighborhood Variables: 1. HHS/residential acre (net density) 2. HHS/total acre (gross density) 3. Avg. block size in acres 4.TransitConnectivity Index 5. Distance to employment centers 6.Jobdensity 7. Access to amenities 2 Household Variables 1. Household income 2. Household size Modeling the “T” of the H&T Index We analyze the Urban Form and the Household Characteristics of neighborhoods to predict the three major components of total household transportation costs. Autos Owned + Auto Use + Transit Use Total Transport Cost x price = /unit
Independent Local Environment Variables – Density Measures Local Environment Variable Autos/Household
Independent Local Environment Variables – Access to Jobs and Amenities
Independent Household Variables Autos/Household Autos/Household
Can This… Predict this?
Optimizing the Model • Combining the variables into a model: • Multiple regression modeling to “fit” each of the 3 dependent variables to the 7 independent urban form variables; • Then same modeling is used to “fit” the 2 household variables to the 7 urban independent variables; • for a total of 21 fits to create the pilot model • Model development corroborates with Location Efficiency Study: • The 7 urban form variables, and the two household variables were all needed to optimize the model; • the Urban Form variables are more important than Household variables (in large urban areas)
Seven Urban Form Variables VS. Auto Ownership
Household Variable At 8 HH/Acres auto ownership reduced by 1 car Residual of Auto Ownership Residual of Auto Ownership Controlling for Local Environment Variables Households /Residential acre Median Household Income Model Mechanics • Example of fit for Auto Ownership: Fit of HH Variable Controlling for Local Environment Variables “Fit” Example for an Independent Variable
Considering just housing costs Considering housing and transportation costs Pilot Results: Minneapolis – St. Paul
Applications Proposed Actual to Date
Proposed Users and Uses • Community Groups • Campaigns for transit, community reinvestment, affordable housing, and smart growth • Transportation for Livable Communities, Twin Cities • Red Line Coalition, Roseland Community in Chicago • Business Groups • Common ground for community, government, and business on choices about development, housing, and public investment • Atlanta Quality Growth Task Force • Development and Real Estate Community • New tool for realtors, developers, and bankers to understand, market and capitalize on relative affordability of different neighborhoods • Realtor.com • Support Academic Research • EJ, Effects of Sprawl, Poverty, Economic Development • Temple University Metropolitan Philadelphia Indicators Project
Proposed Users and Uses • Transit Agencies • Estimate benefit or cost to households from service and system changes • Promote transit ridership with savings campaigns • State • “Cost of living” as criteria for state housing & transportation plans, funds • Legislate alignment across jurisdictions to improve cost of living • MPO and County planning • Reduce Transportation Costs as a Goal in long range plans • Target funding programs for TOD, livable communities, etc. • Transportation impacts of fair housing plans, (King County H&CD) • Municipalities • Support changes to ordinances that would better support transit use, and H&T affordability e.g., parking, height, density, inclusionary zoning, etc. • Goal in comprehensive plans
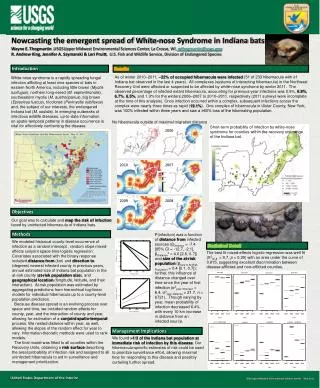
Champaign-Urbana Mass Transit District Long Range Mobility Study • Transport costs are lowest in MTD Service Area • Substantial Growth is occurring outside this area DRAFT
Households that live here ….primarily work elsewhere At greater employment densities, households own fewer autos Champaign-Urbana Mass Transit District Distance to Employment and Amenities has a strong relationship to auto ownership
Understanding the Model Results DRAFT RESULTS
Denver TOD Strategic Planning • For Mayor’s office and Enterprise • Comparing incomes of residents to transportation costs and proposed new lines • Concerns about gentrification, getting good TOD, development costs
Standard Measures and Criterion: Sewer connections New Jobs Median Incomes Congestion Levels Commute Time Alternative Criterion and Measures: Infrastructure costs/capita Jobs in low T cost areas % of income on H+T Commuters by non-SOV Neighborhood mobility levels Chicago Area Planning Agencies • CNT is advocating for its use by RTA in project selection, CMAP in Framework plan, individual municipalities:
High 18% $55,693 23% $43,718 38% $90,447 Housing Costs 23% $64,744 Low High Transportation Costs Can Households Afford Where they Live? A new way to view regions: High H High H&T Low H&T High T
Working Households: ($20,000 to <$50,000) High H: Pushed (22%) • high housing costs, overcrowding to live near jobs and transit • 48% on H+T High T: Pulled (25%) • pulled toward low housing, away from jobs and best transportation • 60% on H+T Low H&T: Stretched (28%) • high incomes, employment centers, little affordable housing • 59% on H+T High H&T: Left Behind (25%) • fewer jobs, fewer amenities and services • 53% on H+T
Transit Zones & Affordability Index • Proximity to transit without density, services, jobs, and walkability will not alone lower transportation costs
Creating 6 versions of the model by metro “type” Applying new models to 49 metro areas Adjusting prices for autos and gasoline Study on 28 metros for NHC released 10/11/06 Project Timeline Fall 2006 Winter 2006-2007 Spring 2007 • Website available by March 31 • Available on DataPlace.org • Free and fee-based information • Use in studies and plans for regions, cities, advocates • Developing website • Reviewing new results with advisory committee • Operations plan to maintain model and website • Use in studies and plans for regions, cities, advocates
Project Information • Center for Neighborhood Technology • Full white paper on the model and Presentations at www.cnt.org/resources • carrie@cnt.org or 773.269.4093 • Brookings Metropolitan Program, UMI • http://www.brookings.edu/metro/umi.htm • Center for Transit-Oriented Development • http://www.reconnectingamerica.org/html/TOD/index.htm