Upper Midwest Environmental Sciences Center – October 2006
10 likes | 169 Vues
Figure 1. American Woodcock ( Scolopax minor ) (USFWS photo). The Conservation Estate of American Woodcock in the Midwestern and Northeastern United States. By Wayne E. Thogmartin and Jason J. Rohweder, U.S. Geological Survey, Upper Midwest Environmental Sciences Center. Introduction.

Upper Midwest Environmental Sciences Center – October 2006
E N D
Presentation Transcript
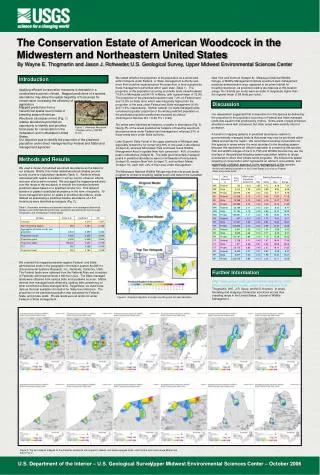
Figure 1. American Woodcock (Scolopax minor) (USFWS photo) The Conservation Estate of American Woodcock in the Midwestern and Northeastern United States By Wayne E. Thogmartin and Jason J. Rohweder,U.S. Geological Survey, Upper Midwest Environmental Sciences Center Introduction We tested whether the proportion of the population as a whole and within hotspots under Federal- or State-management authority was more than could be expected given the proportion of land occupied by these management authorities within each state (Table 1). The proportion of the population occurring on private lands varied between 70.5% in Minnesota and 94.1% in Maine, with a grand mean of 79.9%. The proportion of the predicted population was 7.2% on Federal land and 12.9% on State land, which was marginally higher than the proportion of the area under Federal and State management (6.4% and 11.4%, respectively). Neither federal- nor state-managed lands conserved a greater proportion of the whole predicted population or the predicted population peaks than expected by chance (Kolmolgorov-Smirnov D’s < 0.29, P’s > 0.96). Ten areas were identified as hotspots, or peaks in abundance (Fig. 3). Nearly 3% of the areas predicted as hotspots of breeding woodcock abundance were under Federal land management, whereas 21% of these areas were under State authority. Lake Superior State Forest in the upper peninsula of Michigan was especially noteworthy for conserving 39% of one peak in abundance (hotspot 4), whereas Adirondack Park and Dead Creek Wildlife Management Area in upstate New York conserved ~ 40% of another peak in abundance (hotspot 8). The least governmentally managed peaks in predicted abundance were in northwestern Pennsylvania (hotspot 6), western New York (hotspot 7), and northern Maine (hotspot 10), each with <4% of their area under management. The Missisquoi National Wildlife Refuge may direct its private lands program to conserve breeding habitat south and west of the Canadian border in upstate New York and Vermont (hotspot 8). Missisquoi National Wildlife Refuge, a Wildlife Management Institute woodcock best management practices demonstration area, appeared to be prime habitat for breeding woodcock, as predicted relative abundances at this location (range 16–19 birds per route) were an order of magnitude higher than the regional mean (1.68 birds per route). Applying efficient conservation measures is desirable in a constrained economic climate. Mapped predictions of a species abundance may allow the spatial targeting of focal areas for conservation increasing the efficiency of conservation application. Discussion Mapped predictions from a hierarchical spatial count model of breeding season American Woodcock (Scolopax minor) (Fig. 1) relative abundance provided an opportunity to identify and prioritize focal areas for conservation in the midwestern and northeastern United States. Our assessment suggested that conservation for this species as defined by the proportion of the population occurring on Federal and State managed lands was equal to that predicted by chance. Some areas of peak predicted abundance were well conserved, but other areas were woefully short of protection. A benefit of mapping patterns in predicted abundance relative to governmentally managed lands is that areas may now be prioritized within states and across the region. We recommend focusing conservation for this species in areas where it is most abundant in the breeding season because this represents an efficient approach to conserving this species. Fish and wildlife refuges of the U.S. Fish and Wildlife Service may use the overlays of the predicted breeding season population relative to refuge boundaries to direct their private lands programs. We believe this spatial targeting of conservation effort represents an efficient, accountable, and scientifically justifiable approach to the management of this species. Our objective was to identify the proportion of the predicted population under direct management by Federal and State land management agencies. Methods and Results Table 2. Area occupied by and the proportion of the predicted American Woodcock breeding population in the United States occurring on Federal, State, and private lands We used a model of predicted woodcock abundance as the basis for our analysis. Briefly, this model related woodcock singing ground survey counts to explanatory variables (Table 1). Random effects associated with spatial correlation in survey counts, observer effects, and year effects were included. We averaged the mapped predictions over the range of the woodcock to smooth the transition between predicted values based on a specified circular foci. This allowed isolation of peaks in predicted abundance in the form of isopleths. To focus management action on peaks in predicted abundance, areas defined as possessing a predicted relative abundance of ≥ 5.6 birds/route were identified as hotspots (Fig. 2). Table 1. Parameter estimates and standard deviation from averaged hierarchical, spatial count model describing American woodcock abundance across the upper midwestern and northeastern United States We overlaid this mapped prediction against Federal- and State-administered lands in the geographic information system ArcGIS 9.x (Environmental Systems Research, Inc., Redlands, California, USA). The Federal lands were obtained from the National Atlas and consisted of Federally administered lands ≥ 640 ha in size. The State managed lands were obtained from various state and academic sources. States defined their managed lands differently, yielding little consistency on what constituted a State-managed land. Regardless, we used these data as the best available information for State-level inference. The proportion of the predicted population was calculated for Federal, State, and private lands. Private lands were all lands not under Federal or State management. Further Information http://www.umesc.usgs.gov/terrestrial/migratory_birds/bird_conservation/amwo_american_woodcock.html Thogmartin, W.E., J.R. Sauer, and M.G. Knutson. In press. Modeling and mapping of American woodcock across their breeding range in the United States. Journal of Wildlife Management. Figure 2. Graphical depiction of model smoothing and hot spot derivation Figure 3. Top ten hotspots mapped for the American woodcock with respect to federal- and state-managed lands, note that the color ramp range differs from that in Fig. 2 U.S. Department of the Interior – U.S. Geological Survey Upper Midwest Environmental Sciences Center – October 2006