Download
1 / 17
170 likes | 231 Vues
Explore the evolution of anthropogenic lead in corals and seawater near Bermuda over two centuries. Analyze pre-industrial lead levels, isotopic ratios, and environmental impacts.

E N D
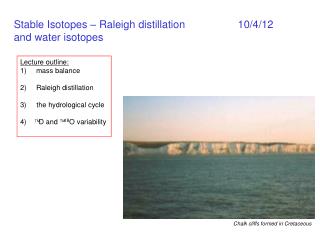
Lead Concentrations and Isotopes in Corals and Water near Bermuda, 1780-2000 Amy E. Kelly, Matthew K. Reuer, Nathalie F. Goodkin, Edward A. Boyle (2009) Earth and Planetary Science Letters 283, 93-100
MIT Pb concentration data (Boyle) from US GT NAT-2010 transect compared to MIT data from nearby stations from 1989 and 1999.
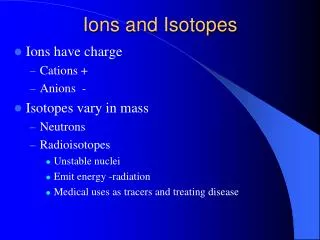
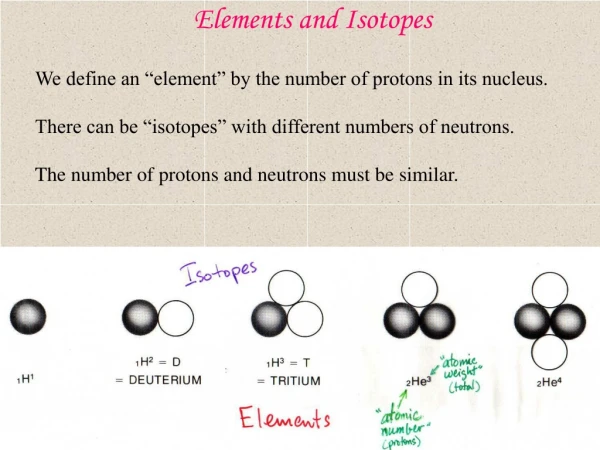
Background • A certain amount of lead (Pb) naturally occurs in the oceans • Human industry has increased the concentration of Pb in the earth’s oceans since the Industrial Revolution. Sources have different ratios of stable isotope (204Pb, 206Pb, 207Pb, 208Pb). 204Pb is primordial. • Back-dating Pb deposits in coral can tell us about historic Pb levels in the ocean • The amount of Pb that corals incorporate into their calcium (Ca) structures is proportional to the Pb concentration in the water where they live. First order removal process!
Fig 1: Location of Study • Bermuda • Coral atoll (North Rock, 11m; Smith’s Bay, 15m) • Atlantic Ocean (BATS) • Westerly winds carry aerosols with Pb from the US. • (some) European Pb aerosols are carried there as well. • Residence time in surface SW ~ 2 years
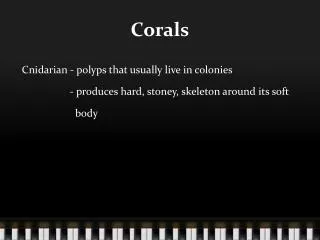
Types of Coral used • Diploriastrigosa • Diplorialabyrinthiformis http://www.reefcolors.de/Galleries/2006_Varadero/index.html http://www.dcbiodata.net/explorer/results/detail/5258
2 Key Questions: • What are the pre-anthropogenic Pb concentration and Pb I.R. (isotope ratios) of corals and seawater? • How has the anthropogenic Pb component evolved isotopically through time?
Fig 2: Pb/Ca ratios in coralraw data: note JSB higher than NR Range is 4 to 80 nmolPb/mol Ca Average JSB to 1938 = 5.0 (using Dp = 3.6; [Pb] = 15 pmol kg-1)
Partition Coefficients (Dp) Controls: thermodynamics and crystal chemistry but also coral species, temperature, growth rate Casw = 10.3 mmol kg-1
Fig 3: Inferred Pb Concentrations from North Rock (best record for North Atlantic) Leaded gasoline coal + ore 15 to 80 pM
Fig 4: Inferred Pb Concentrations from John Smith’s Bay 15% higher than NR
Lead Isotope Ratios (I.R.s) • When the earth was formed, mineral deposits formed with different I.R.s in different places (especially 206Pb/207Pb and 208Pb/206Pb) • By looking at the I.R.s present in the Bermudan corals over time, we can infer where the Pbcame from
Fig 5: 206Pb/207Pb from John Smith’s Bay UMV US Europe Ratio of 1.20 similar to NW Atlantic sediments and manganese nodules. Nature lead.