Download
1 / 21
210 likes | 299 Vues
Relative Responsibility Assessment of Sectors and States: Oxidized-Nitrogen Deposition in 2020. Robin L. Dennis NOAA/EPA Atmospheric SciencesModeling Division January 10, 2007 Chesapeake Bay Modeling Subcommittee Meeting Annapolis, MD. Total Ox-N Deposition Decreases Significantly

E N D
Relative Responsibility Assessment of Sectors and States:Oxidized-Nitrogen Deposition in 2020 Robin L. Dennis NOAA/EPA Atmospheric SciencesModeling Division January 10, 2007 Chesapeake Bay Modeling Subcommittee Meeting Annapolis, MD
Total Ox-N Deposition Decreases Significantly Between 2001 and 2020 Due to Air Regulations Decrease
Decrease However: Decreases in total ox-N deposition are severely mitigated by increases in total red-N deposition, driven by dry deposition. Note: We believe red-N dry deposition is too high in CMAQ. Also, OAQPS will no longer grow NH3 emissions in its new 2020 projections. Increase
Time Trend in Proportions of Ox-N and Red-Nfrom ExtRADM (1990) and CMAQ(averaged over Chesapeake Bay watershed) Low = Reduced dry deposition of ammonia (adapted from sensitivity study) + less growth over time. These are judged to be more “realistic” conditions than the Base Case, which is the High case.
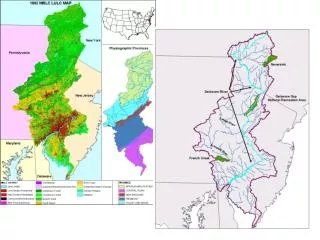
The Average Proportion of 40:60 for 2020 is Highly Variable Across the Chesapeake Watershed
Oxidized-Nitrogen Deposition2020 Sector Responsibility: Power Plants %
Oxidized-Nitrogen Deposition2020 Sector Responsibility: Mobile Sources %
Old 1990 Sector Maps: Industry Note scale change
Old 1990 Sector Maps: Other Note scale change
Oxidized-Nitrogen Deposition2020 Sector Responsibility: Industry %
Oxidized Nitrogen DepositionSector Responsibility(Preliminary)
Oxidized Nitrogen DepositionSector Responsibility(Preliminary)
Oxidized Nitrogen DepositionSector Responsibility(Preliminary)
Relative Responsibility for Ox-N Deposition to Watershed: Airshed and Bay States1990 Results from ExtRADM Relative Responsibility:Airshed and Bay States2001 and 2020 Results from CMAQYet to Come – Suspicion: Both %’s will increase by 2020
Problem with Bay State Calculations We ran into a nonlinearity in the brute-force sensitivity approach we use to assess relative responsibility. CMAQ has more up-to-date dynamics for the gas-particle partitioning. • The result is an overestimate of the relative responsibility for each member. Thus, when we add together the individual responsibility percentages, they sum to much more than 100. • This affected the localized State responsibility results more than the across-the-board Sector responsibility results. We believe the sensitivity to the nonlinearity is significantly enhanced for 2020 conditions, compared to 1990, due to the increased relative importance of ammonia. We will need to employ a more accurate mathematical approach to replace the brute-force sensitivity approach. We have a new approach available for set up with CMAQ.
Distribution of Bay State Responsibilityfor Bay State Deposition to the Watershed(NOT a % of overall responsibility) Relative responsibility stays pretty similar over time. But, Maryland and Pennsylvania get closer together.
Future Work/Next StepsRelated to Responsibility Determinations • Bay State Contributions Using More Advanced Technique • 2001 (to get a more current estimate) • 2020 (to see where we are going) • Sector Contributions Using More Advanced Technique • 2001 • 2020 (better establish the change identified to date) • Airshed Contribution Using More Advanced Technique • 2001 • 2020 (we expect a change between 2001 and 2020) • Ammonia • Trend in emissions: Harmonize with Bay Program • Better dry deposition rate in CMAQ