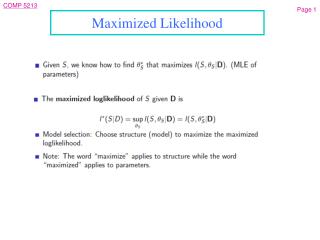
Empirical Likelihood
Empirical Likelihood. Mai Zhou Department of Statistics University of Kentucky. A new (2001) book by A. Owen “Empirical Likelihood” . But Cox model with likelihood ratio output exists for a long time. SAS proc phreg , Splus/R function coxph( ) all have it computed.

Empirical Likelihood
E N D
Presentation Transcript
Empirical Likelihood Mai Zhou Department of Statistics University of Kentucky
A new (2001) book by A. Owen “Empirical Likelihood” . But Cox model with likelihood ratio output exists for a long time. SAS proc phreg, Splus/R function coxph( ) all have it computed. Claim: The (partial) likelihood ratio statistic for the regression coefficients in Cox model can be interpreted as a case of Empirical Likelihood Ratio. (Pan 1997)
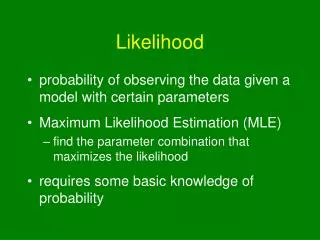
Empirical Likelihood allows the statistician to employ likelihood methods, without having to pick a parametric family of distributions for the data. --- Owen Empirical Likelihood allows for testing hypothesis and constructing confidence regions without a variance estimator.
The advantage is most visible • When sample sizes are small—medium • When parameter(s) is/are near boundary
For n observations, • independent, from the empirical likelihood is • EL(F) = Where
Censored Observations • For a right censored observation , the likelihood contribution is • For a left censored observation the contribution is • Interval censored:
Truncated observations For a left truncated observation (often referred to as delayed entry) : (entry time, survival time) = • The likelihood contribution is • If the survival time is right censored, then the contribution is
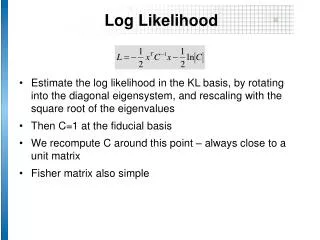
Maximize the log empirical likelihood with/without the mean fixed at a given value. (or median or hazard or … ) -2 [max log EL(mean fixed) – max log EL(not fixed)] Has an approximate chi-square distribution if the mean is fixed at correct value – the null hypothesis. (proofs are rather involved for censored data, the maximizer is difficult to describe….) (actual computation is easier -- iteration)
Idea of proof: construct distributions • Such that the Kaplan-Meier estimator. • Where is a 1-dim parameter, is a function • It is easier to find the max for this family of distributions, easier to workout the asymptotics. (fix ) • We then max over all possible
Quantity to be fixed 1. 2. Where and or are given.
Once we proved the chi-square limiting distribution for the –2 log lik ratio (Wilks Theorem), the implementation is simple conceptually – finding the maximums. leaves the dirty work to computer – search for the maximum. • This feature is similar to the bootstrap method.
Software R is “Gnu S” or free Splus http://www.cran-us.org http://www.r-project.org Many additional packages available for R. • There is a package called emplik, mostly does testing hypothesis using empirical likelihood ratio with censored or truncated data
library(emplik) library(help=emplik) el.cen.EM(x, d, fun=gfun, mu=0.5)
Paired comparison, log(times) • Y1 Y2 d=Y1-Y2 • 2.73 2.98+ -0.25-- • 2.80 2.98+ -0.18-- • 2.01 2.84 -0.83 • 2.19 2.76 -0.57 • 2.34 2.83 -0.49 …………………………………… • 2.97 2.64 0.33 • 2.74 2.31 0.43 • 2.96 2.51 0.45 • 2.98+ 2.68 0.30+
Test : median of (Y1-Y2)=0 • The largest loglik is -41.19336 • The loglik at median =0 is -41.43003 • The chi-sq statistic is • 2x(-41.19336+41.43003)=0.47334 • The P-value is 0.5085 • 95% confidence interval= [-0.57, 0.33] • The P-value is 0.5085
Improving estimation/testing in Cox proportional hazards model Make use of additional information on the baseline hazard library(coxEL) coxphEL(Surv(time, status)~x, gfun=myfun, lam=0.2 )