Download
1 / 26
270 likes | 597 Vues
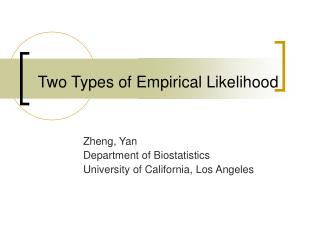
Relevance Vector Machines with Empirical Likelihood-Ratio Kernels for PLDA Speaker Verification. Wei Rao and Man-Wai Mak. ISCSLP 2014. Department of Electronic and Information Engineering The Hong Kong Polytechnic University, Hong Kong SAR, China. Summary.

E N D
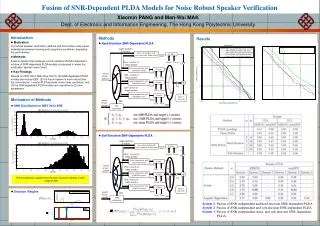
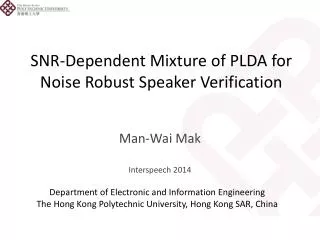
Relevance Vector Machines with Empirical Likelihood-Ratio Kernels for PLDA Speaker Verification Wei Rao and Man-Wai Mak ISCSLP 2014 Department of Electronic and Information Engineering The Hong Kong Polytechnic University, Hong Kong SAR, China
Summary • Our previous studies have shown that PLDA-SVM scoring have three advantages: • Better utilization of multiple enrollment utterances. • Use the information of background speakers explicitly. • Open up opportunity for adopting sparse kernel machines for PLDA-based speaker verification systems. • In this work, we • investigate the property of empirical kernels in SVM and relevance vector machine (RVM) • compare the performance between SVM and RVM in PLDA-based speaker verification.
Outline • Empirical LR Kernels • Likelihood Ratio Score for Gaussian PLDA • PLDA Score Space • Empirical Kernel Map • SVM with Empirical Kernels • Relevance Vector Machines • RVM vs. SVM • Limitations of SVM • RVM Regression • PLDA-RVM Scoring • Experiment Setup • Results • Conclusions
Likelihood Ratio Score for Gaussian PLDA Implicitly use background information is the factor loading matrix and is the covariance of the PLDA model. Given a length-normalized test i-vector and target speaker’s i-vector , the likelihood ratio score can be computed as follows:
PLDA Score Space Score vectors of background speakers PLDA Model Constructing PLDA Score Vector Speaker-dependent SVM SVM Training Given a set of target speaker’s i-vectors and a set of background speakers’ i-vectors we create a PLDA score space for this speaker. For each target-speaker’s i-vector, we compute a score vector that lives in this space. The score vectors of this speakers are used to train a speaker-dependent SVM for scoring.
Empirical Kernel Map PLDA Model Constructing PLDA Score Vector We refer to the mapping from i-vectors to as Empirical Kernel Map. Given a test i-vector , we have a test score-vector
Utterance Partitioning with Acoustic Vector Resampling (UP-AVR) One enrollment utt RN + 1 enrollment i-vectors For speakers with a small number of enrollment utterances, we apply utterance partitioning (Rao and Mak, 2013) to produce more i-vectors from a few utterances.
SVM with Empirical LR Kernel Background speaker’s i-vectors SVM Training Target speaker’s i-vectors PLDA Scoring + Empirical Kernel Map Target speaker SVM PLDA Scoring + Empirical Kernel Map Non-target speakers’ i-vectors Target speaker’s i-vectors Non-target speaker’s i-vectors
Outline • Empirical LR Kernels • Likelihood Ratio Score for Gaussian PLDA • PLDA Score Space • Empirical Kernel Map • SVM with Empirical Kernels • Relevance Vector Machines • RVM vs. SVM • Limitations of SVM • RVM Regression • PLDA-RVM Scoring • Experiment Setup • Results • Conclusions
RVM versus SVM • Differencebetween RVM and SVM • SVM training is based on Structural Risk Minimization • RVM training is based on Bayesian Relevance Learning RVM stands for relevance vector machine (Tipping, 2001) The scoring function of RVM and SVM is the same: where are the optimized weights. is a bias term. is a kernel function, e.g. empirical LR kernel.
Limitations of SVM RVM is designed to address the above issues in SVM The number of support vectors in SVM increases linearly with the size of the training set. The SVM scores are not probabilistic, meaning that score normalization is required to adjust the score range of individual SVMs. It is necessary to tradeoff the training error and margin of separation through adjusting the penalty factor for each target speaker during SVM training.
RVM Regression In RVM regression, the target y is assumed to follow a Gaussian distribution with mean and variance To avoid over-fitting, RVM defines a prior distribution over the RVM weights w Note: when
RVM Regression • Given a test vector , the predictive distribution is where
PLDA-RVM Scoring • We use the mean of the predictive distribution as the verification score: where
Outline • Empirical LR Kernels • Likelihood Ratio Score for Gaussian PLDA • PLDA Score Space • Empirical Kernel Map • SVM with Empirical Kernels • Relevance Vector Machines • RVM vs. SVM • Limitations of SVM • RVM Regression • PLDA-RVM Scoring • Experiment Setup • Results • Conclusions
Speech Data and PLDA Models Evaluation dataset: Common evaluation condition 2 of NIST SRE 2012 male core set. Parameterization: 19 MFCCs together with energy plus their 1st and 2nd derivatives 60-Dim UBM:gender-dependent, 1024 mixtures Total Variability Matrix:gender-dependent, 400 total factors I-Vector Preprocessing: Whitening by WCCN then length normalization Followed by LDA (500-dim 200-dim) and WCCN
Property of Empirical LR Kernels in SVM and RVM • When the number of SVs increases, the performance of SVMs becomes poor. • When the number of RVs is very small, the performance of RVM is poor. • The performance of RVM is fairly stable and better than that of SVMs once the number of RVs is sufficient.
Property of Empirical LR Kernels in SVM and RVM RBF Width γ • When the RBF width increases, the number of SVs decreases first and then gradually increases. • The number of RVs monotonically decreases when the RBF width increases. • The RVMs is less sparse than the SVMs for a wide range of RBF width.
Property of Empirical LR Kernels in SVM and RVM RBF Width γ • For the RVMs to be effective, we need at least 50 RVs. • Once the RVMs have sufficient RVs, their performance can be better than that of the SVMs.
Performance Comparison (CC2 of SRE12, male) • Both PLDA-SVM and PLDA-RVM (regression) perform better than PLDA. • RVM classification performs poorly because of the small number of RVs. • After performing utterance partitioning (UP-AVR), the performance of both RVM regression and SVM improves and RVM regression slightly outperforms SVM.
Conclusions RVM classification is not appropriate for the verification task in NIST SRE, but RVM regression with empirical LR kernel can achieve comparable performance as PLDA-SVM. UP-AVR can boost the performance of both SVM and RVM regression and the performance of RVM regression is slightly better than SVM after adopting utterance partitioning.
Thank You Q & A
Optimization of RBF Width The preferred value of for RVMs is between 1400 and 1500 and that for SVMs is between 1900 and 2000.
Property of Empirical LR Kernels in SVM and RVM • 108 target speakers with true-target trials and imposter trials were extracted from NIST 2012 SRE. • EER and achieved by the SVMs and RVMs and their corresponding number of support vectors (SVs) and relevance vectors (RVs) were averaged across the 108 speakers.
Experiment Setup for SVM and RVM • Optimization of RBF Width: a development set was created for optimizing RBF parameter for each target speakers’ SVM/RVM. • True-target trials: UP-AVR was applied for his/her enrollment utterances to generate a number of enrollment i-vectors. Some of these i-vectors are used for training SVM/RVM model. The remaining i-vectors were used as true-target trials. • Imposter trials: 200 background utterances were selected from the previous NIST SREs. • Varying the width to maximize the difference between the mean of the true-target scores and the mean of the imposter scores.