SPEAKER VERIFICATION USING SUPPORT VECTOR MACHINES
SPEAKER VERIFICATION USING SUPPORT VECTOR MACHINES. S. Raghavan, G. Lazarou and J. Picone Intelligent Electronic Systems Center for Advanced Vehicular Systems Mississippi State University URL: http://www.cavs.msstate.edu/hse/ies/publications/conferences/ieee_secon/2006/support_vectors/.

SPEAKER VERIFICATION USING SUPPORT VECTOR MACHINES
E N D
Presentation Transcript
SPEAKER VERIFICATIONUSING SUPPORT VECTOR MACHINES S. Raghavan, G. Lazarou and J. Picone Intelligent Electronic Systems Center for Advanced Vehicular Systems Mississippi State University URL: http://www.cavs.msstate.edu/hse/ies/publications/conferences/ieee_secon/2006/support_vectors/
Speaker Verification • Speaker verification uses voice as a biometric to determine the authenticity of a user. • Speaker verification systems consist of two essential operations: • Enrollment: the system learns the speaker’s acoustic informationand builds a speaker model or template. • Verification: the claimed speaker is compared to the model and a likelihood score is computed. A threshold is used to discriminate true speaker from an impostor. This presentation focuses on the classifier portion of the speaker verification system.
Baseline System • This is an example of a distribution of the fourth cepstral coefficient from one of the utterances taken from the NIST 2003 Speaker Recognition dataset. • The distribution cannot be modeled by a single Gaussian. • By using two Gaussians, we can achieve a more accurate representation of the model. • The baseline system used a Gaussian Mixture Model (GMM) as the underlying classifier. • The system used 39 dimensional Mel Frequency Cepstral Coefficients (MFCCs) as input features. Train Utterance Statistical Model Test Utterance Decision Compute Likelihood
Drawbacks of Using Gaussian Mixtures • The probability of obtaining the correct hypothesis given the test data is a posterior probability, and it can be decomposed into a prior and conditional probability using the Bayes rule. • The parameters for P(A/S) are estimated from the data using Maximum Likelihood Estimation (MLE). • The parametric form of P(A/S) is generally assumed to be Gaussian. • Since the acoustic data may not actually be Gaussian, we will end up with approximations that lead to classification errors.
Optimal Decision Boundary • Maximum likelihood convergence does not translate to optimal classification if a priori assumptions about the data are not correct. • At best one can approximate the distribution by using a mixture of Gaussians, but still the problem of finding the optimal decision boundary still remains. • SVM does not make a Gaussian assumption. Instead it is a purely discriminative approach where the boundaries are directly learnedfrom the data.
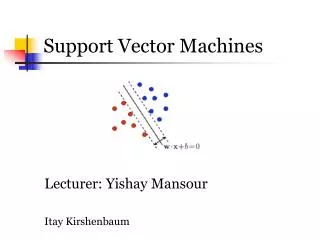
C2 H2 CO C1 class 1 H1 w optimal class 2 classifier • Support Vector Machines (SVMs) • SVMs are binary classifiers that learn the decision region through discriminative training. • SVMs transform data to a higher dimensional space using kernel functions. • In the higher dimensional space, SVMs can construct a linear hyperplane to form the decision boundary, which in lower dimension would require a non-linear decision boundary. • SVMs require labeled data for training. • SVMs find an optimal decision boundary. • Hyperplanes C0-C2 achieve zero empirical risk. C0 generalizes optimally. • The data points that define the boundary are called support vectors.
Using SVMs for Optimal Decision Boundary • Hyperplane: • Constraints: • Quadratic optimization of a Lagrange functional minimizes risk criterion (maximizes margin). Only a small portion become support vectors. • Final Classifier: SVM classifier- classification error rate 21.15% LBG classifier- classification error rate 27.88%
Using SVMs for Speaker Verification • Speaker verification requires the system to make a binary decision. • The decision boundary can be learned from labeled data. • An SVM classifier is ideally suited for such a task. It requires two sets of labeled data: in-class and out-of-class. • The impostor data can consist of data from all speakers excluding the speaker whose data is used as in-class. • A classifier must be trained for each speaker. • During verification the speaker’s utterance is matched with the claimed identity’s classifier ( ).
Block Diagram of SVM Based Speaker Verification TRAINING Using Structural Risk Minimization (SRM) A model is created for every speaker in the training data set in-class data Train the model SVM model out-class data Test data Distance from the hyperplane between -1 to 1 if (distance < threshold) {Reject Speaker} else {Accept Speaker} TESTING claimed model • The input data contains 39-dimensional MFCCs. • The in-class data corresponds to a particular speaker and the out-of-class data contains features of all other speakers. • The SVM model contains the support vectors and the weights.
Experimental Design • Database: NIST 2003. The development train and test set contained 60 and 78 utterances respectively. Each utterance was approximately 2 minutes long. • Standard 39-dimensional MFCCs were used as features. • The in-class data for training contained the entire feature set from the speaker utterance. • The out-of-class data for training contained randomly picked features from all the remaining speakers in the training data set. Note: The SVM trainer was not exposed to all the data available for out-of-class. This was done in order to speed up the training process. • During testing, the distance of every MFCC test vector from the hyperplane is computed and averaged. If this average is greater than zero, we accept the speaker, else we reject the speaker. • A Detection Error Trade off curve was plotted, using the true speaker and impostor speaker distances. This was compared with the baseline GMM speaker verification system.
Analyzing the Effect of Training Parameters • The parameters were varied based on the Detection Cost Function (DCF): • CDet = [CMiss × P(Miss|Target) × P(Target)] + • [CFalseAlarm× P(FalseAlarm|NonTarget) × (1-P(Target))] • The NIST DET curve analysis program was used to obtain the DCF values. • Two main parameters were analyzed: • Penalty (C): This parameter accounts for the training errors. This value was varied from 10 – 100 and no significant change in performance was noted. Hence a mid value of 50 was chosen. • Kernel parameter (gamma): For gamma values between 2.5 to 0.02 there was no change in the distance scores of the utterances in the test set. The performance was stable between 0.03 and 0.01. The best performance was observed when gamma was 0.019.
Effect of Penalty and Kernel Parameters DET curves for various values of the RBF kernel parameter Gamma Minimum DCF as a function of Gamma Miss probability (in %) False Alarm probability (in %) • The DET curve helps in selecting a decision threshold. • The DET curve also helps in choosing an optimal operating region for the system.
SVM Vs GMM (Baseline System) • The EER improved by 9% absolute. • The Min-DCF improved by 33% relative. • The results are promising since only a small portion of the entire data was used as out-of-class data. • Also the system uses a very simple averaging strategy to make yes/no decision. A more intelligent approach would yield better results. Miss probability (in %) False Alarm probability (in %)
Conclusions and Future Work • Conclusions: • The SVM system performed significantly better than the GMM baseline system. • The Equal Error Rateimproved by 9% absolute. • The Min-DCF value improved by 33% relative. • The effect of RBF kernel parameter was analyzed [… state the result! …] • A speaker verification framework has been laid out. [… not a good conclusion!]… • Future Work: • Improving training efficiency of SVMs using subsampling strategy. Determine the support vectors from small subsets of the training data. • Relevance Vector Machines (RVMs) for speaker verification. • Use more robust features to train the classifier (features that capture the nonlinearities present in the speech signal). • Research on a better technique to determine the score for a speaker.
Pattern Recognition Applet: compare popular algorithms on standard or custom data sets • Speech Recognition Toolkits: compare SVMs and RVMs to standard approaches using a state of the art ASR toolkit • Foundation Classes: generic C++ implementations of many popular statistical modeling approaches • Resources
References • J.P. Campbell, “Speaker Recognition: A Tutorial,” Proceedings of IEEE, pp. 1437-1462, September 1997. • D. A. Reynolds, “Speaker identification and verification using Gaussian mixture speaker models,” Speech Commun, pp. 91–108, 1995. • A. Ganapathiraju, “Support Vector Machines for Speech Recognition,” Ph.D. Dissertation, Department of Electrical and Computer Engineering, Mississippi State University, January 2002. • W. M. Campbell, E. Singer, P. A. Torres-Carrasquillo, and D. A. Reynolds, “Language Recognition with Support Vector Machines,” Proc. Odyssey: The Speaker and Language Recognition Workshop, Toledo, Spain, ISCA, pp. 41-44, 31 June 2004. • J. Picone, “Signal Modeling Techniques in Speech Recognition,” IEEE Proceedings, vol. 81, no. 9, pp. 1215-1247, September 1993. • “NIST 2003 Speaker Recognition Evaluation Plan,” http://www.nist.gov/speech/tests/spk/2003/doc/2003-spkrec-evalplan-v2.2.pdf, March 2006. • A. Martin, G. Doddington, M. Ordowski, and M. Przybocki, “The DET curve in assessment of detection task performance,”. In Proceedings of EuroSpeech, volume 4, pages 1895--1898, 1997.