Download
1 / 34
350 likes | 543 Vues
Overview of Current Medicaid Delivery Innovations. Andrea Kastin & Caroline Fisher June 13, 2007. States Have Multiple Options for Implementing Medicaid Reform. State Plan Amendments. Waivers. Waiver Templates. Purpose.

E N D
Overview of Current Medicaid Delivery Innovations Andrea Kastin & Caroline Fisher June 13, 2007
States Have Multiple Options for Implementing Medicaid Reform State Plan Amendments Waivers Waiver Templates Purpose Permit states to implement program options that are allowable under federal Medicaid law Permit states to waive sections of the Medicaid statute in order to implement reforms that are not possible under Medicaid law HHS Secretary may release waiver guidance or templates, which are intended to direct states towards specific reform options and speed approval process Speed of Approval Fast – federal approval is procedural; must be completed within 90 days Varies – often lengthy negotiation and Q&A process; no time limit (typically 9-12 months) Moderate – templates speed waiver approval; no time limit (typically 2-6 months) Ability to Negotiate Low – states must adhere to federal limitations High – Secretary can waive almost any provision of the statute, if supportive Low – template sets parameters for application Transparency Low – no public process required for submission or approval Higher – supposed to be a public process with opportunity to comment Moderate – no public control over template design, but still subject to public process
Key Themes of Recent Medicaid Innovations • Medicaid Managed Care • Care Coordination for Medicaid Beneficiaries: • Disease Management • Primary Care Case Management • Long Term Care in Home and Community Based Settings • Coordinated Care Models for Dual Eligibles • Special Needs Plans • PACE • Management of Prescription Drug Costs
Medicaid Risk-Based Managed Care The intersection of business strategy and public policy
Introduction to Medicaid Managed Care • Medicaid was originally designed as a fee-for-service program • Medicaid managed care grew by 900 percent from 1991 to 20041 • States have both mandatory and voluntary enrollment into managed care • 63 percent of Medicaid beneficiaries nationwide are enrolled in some type of managed care • All states—except for AK, NH and WY—have enrolled some portion of their Medicaid population in managed care1 • 36 states rely on private health plans or other organizations to perform these functions2 • In 2005, there were 18.4 million Medicaid managed care beneficiaries enrolled in private plans (MCOs) Sources: 1CMS website: http://www.cms.hhs.gov/MedicaidManagCare/ 2 CMS Medicaid Managed Care Enrollment Report, June 2005
States Use Multiple Models of Managed Care to Deliver Services This presentation focuses on MCOs, which administer comprehensive benefits to Medicaid enrollees.
Medicaid Enrollment in Managed Care Organizations (MCOs) Continues to Grow Nationally Medicaid MCO Penetration, United States1 • Top Medicaid MCO States in 2005 • By Percent Enrollment1: • Tennessee = 100% • Arizona = 100% • Hawaii = 79% • By Total Enrollment1: • California = 3.2M • New York = 2.5M • Tennessee = 1.3M* • By Spending2: • California = $5.5B • Pennsylvania = $4.3B • New York = $4.2B *Tennessee recently reduced its Medicaid eligibility by 400,000 beneficiaries. This change will decrease total MCO enrollment in the state. 1 Avalere analysis of CMS Medicaid Managed Care Enrollment Reports. 2 Avalere analysis of Lewin Group, “Medicaid Capitation Expansion’s Potential Cost Savings, April 2006.
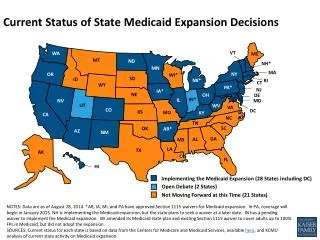
ME WA ND MT NH MN OR NY MA ID WI CT SD RI MI WY PA NJ IA OH NE DE IL IN MD NV UT WV DC VA CA CO KS MO KY NC TN SC OK AR NM AZ GA AL MS LA TX AK FL HI MCO Penetration Varies Greatly by State Percentage of Beneficiaries Enrolled in an MCO by State, 2005 VT None 1-33% 34-66% 67-100% Source: Avalere analysis of CMS Medicaid Managed Care Enrollment Report, June 2005.
ME WA ND MT NH MN OR NY MA ID WI CT SD RI MI WY PA NJ IA OH NE DE IL IN MD NV UT WV DC VA CA CO KS MO KY NC TN SC OK AR NM AZ GA AL MS LA TX AK FL HI But There Is Variation Among States and Some State Have Had Declines Change in Percent of Medicaid Population in Managed Care, 2000 to 2005 VT Increased Stable Declined No MCOs in 2000 and 2005 Note: Medicaid managed care is defined as HIOs, Commercial MCOs, Medicaid-only MCOs, and PACE. Nine states did not have any MCOs in 2000 or 2005, but some of those may utilize other care management tools such as primary care case management. “Stable” is defined as less than 5 percentage points change in enrollment from 2000 to 2005. Source: Avalere analysis of CMS Medicaid Managed Care Enrollment Reports.
The Composition of Medicaid Managed Care Enrollees Continues to Evolve Percentage of States with Medicaid MCOs Enrolling Various Populations, 1990-2002 • Early Medicaid managed care programs focused enrollment on poor moms, kids • Some states now enroll aged and disabled eligibility groups into managed care, but at lower rates than families • 9 states said that they will expand managed care to more eligibility groups in 2006 or 2007* • Most states with managed care programs mandate that certain populations enroll, typically families, pregnant women, and poor children 28 32 38 45 42 41 Source: NASHP, Medicaid Managed Care: Looking Forward, Looking Back, June 2005 *Vern Smith, “Medicaid at a Turning Point: Results from a 50-State Survey on State Budgets and Medicaid Policy Actions for Fiscal Years 2006 and 2007, “ Kaiser Family Foundation, October 2006.
MCOs Are Also Becoming More Medicaid-Focused to Respond to States’ Demands • MCOs that principally or solely enroll Medicaid beneficiaries are a growing force in the market • In 17states Medicaid-focused plans serve a majority of beneficiaries* • Medicaid-focused plans have much higher profit margins than other plans • Growing MCO enrollment of aged & disabled beneficiaries may favor Medicaid-focused plans Sources: KFF. Trends in Health Plans Serving Medicaid – 2000 Data Update, November 2001; NASHP, Medicaid Managed Care: Looking Forward, Looking Back, June 2005; CHCS, “Understanding the Influence of Publicly Traded Health Plans in Medicaid Managed Care,” November 2006. *CMS, Medicaid Managed Care Enrollment Report, June 2005.
State Contracting Requirements Can Also Promote Market Consolidation • To promote statewide coverage, some states are requiring plans to bid to cover vast regions, including rural areas • This design can disadvantage smaller, local MCOs that lack broad provider networks • Especially true for provider-owned MCOs that tend to be localized in specific urban areas The Georgia Example: Georgia recently shifted to mandatory MCO enrollment for 1 million Medicaid and SCHIP beneficiaries. The state was split into several regions for MCO contracting purposes, and plans were required to show adequate provider networks to win in a given region. State rules stipulated that in order for a plan to be eligible to bid on the Atlanta region (half of all lives) it must have won another region in the state. Source: Avalere analysis.
Medicaid Care Coordination The intersection of business strategy and public policy
Disease Management is a Key Component of Care Coordination Across Medicaid Delivery Systems • Disease management (DM) programs monitor, educate, treat beneficiaries with specific illnesses • Integral to coordinating Medicaid beneficiary care • DM efforts began in risk-based MCOs • State Medicaid FFS programs are now using DM extensively • The most common conditions managed by Medicaid FFS DM programs include: • Diabetes • Asthma • Congestive heart failure • States typically have more than one Medicaid DM program operating
WA ME MT ND VT NH MN OR MA WI NY ID RI SD CT MI WY PA NJ IA NE OH DE NV IL IN MD WV UT VA D.C. CA CO MO KY KS NC TN OK SC AZ AR NM MS AL GA LA TX AK FL HI Over 20 State FFS Medicaid Programs Provide DM to Beneficiaries DM Program Operational None Sources: Avalere primary research; the Centers for Medicare and Medicaid Services Medicaid Disease Management Programs data from January 2004 available at http://www.dmnow.org/states/PDFs/CMSsnapshot.pdf ; and National Pharmaceutical Council’s Medicaid Disease Management and Health Outcomes webpage, available at http://www.dmnow.org/states/statelist.asp
Virginia First State to Use DRA SPA to Operate DM Program • Healthy Returns, VA’s DM program, first to operate under DRA benchmark plan • Asthma, congestive heart failure, coronary artery disease, diabetes • A beneficiary with one of the listed diseases may enroll in a benchmark plan to receive DM • Excludes beneficiaries enrolled in MCOs, dual eligibles, institutionalized individuals, and beneficiaries with third party insurance • DM benchmark beneficiaries receive: • Condition-specific education • Access to 24-hour nurse call line • Regularly scheduled telephonic care management, and care coordination • Virginia anticipates 20,000-25,000 beneficiaries eligible for “Healthy Returns” benchmark plans
MCOs Are Pioneers in Bringing Disease Management to Medicaid • Medicaid MCOs, operating in 47 states, have a long history of applying disease management (DM) services • However, because aged, blind or disabled beneficiaries are more likely to remain in fee-for-service programs, Medicaid MCOs generally enroll healthier populations relative to the total Medicaid population and use tools that may not be as effective for more vulnerable populations • Medicaid MCO DM programs and tools offer similar coordinated care and prevention services as private sector programs • Some Medicaid MCOs outsource DM programs, paying vendors based on performance metrics Source: Avalere analysis of California Health Care Foundation presentation
Primary Care Case Management (PCCM) Is Another Care Coordination Mechanism Used By Many States • Primary care providers enter into agreement with state to manage Medicaid beneficiary care • State provides small per-member-per-month administrative fee • Providers paid on fee-for-service basis for services provided to beneficiary • Programs may include: • Disease management • Service utilization management • Strict provider credentialing • Member surveys/Complaint Logs • Care coordination across multiple providers and conditions • 24-hour member services • Selective provider contracting • HEDIS measure reporting • Member education
WA ME MT ND VT NH MN OR MA WI NY ID RI SD CT MI WY PA NJ IA NE OH DE NV IL IN MD WV UT VA D.C. CA CO MO KY KS NC TN OK SC AZ AR NM MS AL GA LA TX AK FL HI Nearly 30 States Operate PCCM Programs That Cover Nearly 6.6 Million Medicaid Beneficiaries PCCM Program Operational Source: 2005 CMS Medicaid Managed Care Enrollment Report
Delivery of Long Term Care Services The intersection of business strategy and public policy
Changes to the Delivery of Medicaid Long Term Care (LTC) Services Have Not Shown Proven Cost Savings • 1970s: Sharp rise in Medicaid nursing facility costs; sparked lawmaker concern • 1981: Congress created Medicaid Home and Community Based Services (HCBS) waiver program • HCBS grew quickly • Preferred by consumers (Olmstead decision) • Did not slow growth of Medicaid nursing home expenditures • 1990s: States adopted Medicaid managed acute care programs, leading a handful of states to create Medicaid managed long term care (MMLTC) programs • MMLTC not widely spread among states • States continue to rely on FFS Medicaid to administer LTC benefits HCBS is a key component of both FFS and MMLTC coverage. Source: Saucier, Paul, Brian Burwell, and Kerstin Gerst, The Past, Present and Future of Managed Long-Term Care, prepared for the HHS Office of the Assistant Secretary for Planning and Evaluation April 2005.
HCBS Enrollment and HCBS-Related State Spending Continue to Grow Source: Kaiser Family Foundation, Medicaid 1915 (c) HCBS Programs: Data Update, December 2006.
Iowa First State to Use DRA Authority to Make HCBS Permanent Provision Within State Plan • Deficit Reduction Act (DRA) permits states to offer HCBS under a state plan option effective January 1, 2007 • Mentally ill Iowans earning up to 150% FPL and eligible for Iowa Medicaid may receive services under the HCBS state plan • Covered services include: • Case management services • Habilitation services at home or in day treatment programs • Prevocational programs • Supported employment
Care For Dual Eligibles The intersection of business strategy and public policy
Care For Dual Eligibles is Fragmented • Duals can receiving coverage from a combination of the following payers: • Medicare Advantage • Medicare FFS (Parts A & B) • Medicare Part D • Special Needs Plans • Medicaid MCOs for acute care services • Medicaid managed care for long term care services • Medicaid FFS • States are looking toward SNPs, along with several other models, to integrate acute and LTC services and health care payers
Current Delivery System Medicare and Medicaid administered by different units of government No vehicle for beneficiary health care information exchange Medicare and Medicaid cover some of same services but with different service definitions and limits Medicaid covers key services Medicare does not Some States Using SNPs To Deliver Integrated Medicare and Medicaid Services Integrated SNP Delivery System • Plans contract with CMS for Medicare Advantage services; state contracts for Medicaid MCO services • Care coordination provides assistance with service access, tracking, utilization management • SNP gets capitated payments for duals from both Medicare and Medicaid
2007 SNP Enrollment Is Primarily In Dual Eligible SNPs SNP Enrollment by SNP Type (3/07) N = 842,840 March 2007 numbers reflect a total enrollment increase of 240,000 since Fall 2006 Source: Avalere Health analysis using DataFrameTM, a proprietary database of Medicare Part D plan features. Enrollment data as of September 2006 and March 2007.Analysis excludes lives in Part D plans with fewer than 10 enrollees. Includes lives enrolled in employer/union only Part D plans and the U.S. territories.
PACE Model Used By States to Integrate Medicare and Medicaid Services Since Early 1980s Program for All-Inclusive Care for the Elderly (PACE) • Capitated managed care created in 1980s for dual eligibles over the age of 55 needing nursing facility care who live in a PACE service area • Delivers needed medical and support services while maintaining beneficiary independence in their homes for as long as possible • Balanced Budget Act of 1997 lets states implement PACE programs for Medicaid populations without a waiver • Recognizes PACE model as a permanent provider type under both the Medicare and Medicaid programs • Currently 46 PACE sites throughout US; providers include community organizations in conjunction with provider teams • Approximately 70,000 individuals are enrolled in PACE (2004) Sources: National PACE Association Website, available at http://www.npaonline.org/website/download.asp?id=1740. State Coverage Initiatives, Integrating Medicare and Medicaid: A Briefing Paper, February 2001; AARP Public Policy Institute Issue Brief, Medicaid Managed Long-Term Care, 2005.
Management of Prescription Drug Costs The intersection of business strategy and public policy
MCO-style Utilization Management Is Commonin Medicaid FFS Pharmacy Programs • Many states also contract with pharmacy benefit managers (PBMs), similar to commercial plans. • PBMs’ roles differ across states: • Administer pharmacy program • Process drug claims and coordinate with other payers • Assist with PDL coverage determinations • Negotiate supplemental rebates • Pool purchasing power with other states to increase negotiating power 1Avalere tracking and analysis. 2National Pharmaceutical Council, “Pharmaceutical Benefits under State Medical Assistance Programs, 2004.” 3CMS, “Medicaid Prescription Reimbursement Information by State,” September 2006.
No PDL PDL Enabling Legislation PDL Legislation Recently Failed PDLs Have Become the Predominant Medicaid Drug Cost Containment Strategy WA ME MT ND VT All 50 states require prior authorization to control access for specific drug classes. NH MN OR MA WI NY ID RI SD CT MI WY PA NJ IA NE OH DE NV IL IN MD WV UT VA D.C. CA CO MO KY KS NC TN OK SC AZ AR NM MS AL GA PDL Currently Operating LA TX AK PDL Planned FL HI Source: Avalere Health, as of February 2007. Note: Oklahoma does not have a PDL, but a Product Based Prior Authorization (PBPA) process, but it operates similarly to a PDL
WA ME MT ND VT NH MN OR MA WI NY ID RI SD CT MI WY PA NJ IA NE OH DE NV IL IN MD WV UT VA D.C. CA CO MO KY KS NC TN OK SC AZ AR NM MS AL GA LA TX AK FL HI Twenty States Now Participate in Three Medicaid Purchasing Pools State Participation in Multi-State Prescription Drug Bulk Purchasing Pools National Medicaid Pooling Initiative (NMPI) – Administered by First Health TOP$ – Administered by Provider Synergies* Sovereign States Drug Consortium (SSDC) – Administered by MedMetrics** State does not participate in a pool Source: NCSL *In 2006, First Health aquired Provider Synergies. However, the NMPI and TOP$ pools are still administered separately. Combining the pools would require CMS approval. **MedMetrics is a non-profit PBM started by Univ. of Mass Med School
WA ME MT ND VT NH MN OR MA WI NY ID RI SD CT MI WY PA NJ IA NE OH DE NV IL IN MD WV UT VA D.C. CA CO MO KY KS NC TN OK SC AZ AR NM MS AL GA LA TX AK FL HI All Drugs Carved Out Partial Drug Carve-Outs No Drugs Carved Out Eleven States Carve-Out All Drugs from MCO Contracts States increasingly carve out some services from MCO capitation • Carve-outs allow states to contract with specialized vendors for particular services • States retain greater control over carved out benefits • States that carve out pharmacy services can collect rebates Drugs Carved-Out of Medicaid MCO Capitation Source: Avalere analysis.