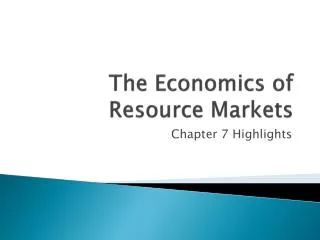
Understanding Resource Demand and Supply Dynamics in Markets
This resource delves into the fundamental principles of resource demand and supply as outlined in Chapter 11 of the 2006 Thomson/South-Western publication. It describes how firms hire additional workers to ensure that their marginal revenue exceeds marginal costs. The document highlights the importance of wage differentials, derived demand, and the influence of market forces on resource allocation. Factors such as substitution in production, temporary and permanent price differences, opportunity cost, and economic rent are also analyzed, emphasizing their impact on resource markets.


Understanding Resource Demand and Supply Dynamics in Markets
E N D
Presentation Transcript
Resource Markets Chapter 11 © 2006 Thomson/South-Western
Resource Demand and Supply • As long as the additional revenue from employing another worker exceeds the additional cost, the firm should hire the worker • Resource owners will supply their resources to the highest-paying alternative, other things equal • Since other things are not always equal, resource owners must be paid more to supply their resources to certain uses
r o b a l f o r u o h r e p s r a l l o D Exhibit 1: Resource Market for Carpenters S • The demand curve slopes downward and the supply curve slopes upward • The demand for and supply of resources depends on the willingness and ability of buyers and sellers in resource markets W D 0 E Hours of labor per period
Market Demand for Resources • Firms value a resource for its ability to produce goods and services • Demand depends on the value of what it produces • It is a derived demand: derived from the demand for the final product • Market demand for a particular resource is the sum of demands for that resource in all its different uses • The demand curve slopes downward because as the price of a resource falls, producers are more willing and able to employ that resource
Market Demand for Resources • If the price of a particular resource falls, it becomes relatively cheaper compared to other resources the firm could use to produce the same output: they are more willing to hire this resource • Substitution in production
Market Demand for Resources • A lower price for a resource also increases a producer’s ability to hire that resource • For example, if the wage for carpenters falls, homebuilders can hire more carpenters for the same cost
Market Supply for Resources • The market supply curve of a resource sums all the individual supply curves for that resource • Resource suppliers tend to be both more willing and more able to supply the resource as its price increases => the market supply curve slopes upward
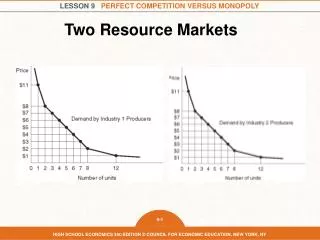
Exhibit 2: Market for Carpenters in Alternative Uses • If carpenters earn $25 an hour to build homes (panel a), $5 more than carpenters making furniture (panel b), some will move from furniture making to home building: the wage in home building decreases and the wage in furniture building increases. Eventually, this shift will continue until the wage is equal at $24 in both markets.
Temporary Differences in Resource Prices • Resource prices sometimes differ temporarily across markets because adjustment takes time • But when resource markets are free to adjust, price differences trigger the reallocation of resources, which equalizes payments for similar resources
Permanent Differences in Resource Prices • Not all resource price differences cause a reallocation of resources • For example, land may lead to permanent differences in prices • Certain wage differentials stem from the different costs of acquiring the education and training required to perform particular tasks • Other earning differentials reflect differences in the nonmonetary aspects of similar jobs
Summary • Temporary price differences spark the movement of resources away from lower-paid uses toward higher-paid uses • Permanent price differences cause no such reallocations • Lack of resource mobility • Differences in the inherent quality of the resource • Differences in the time and money involved in developing the necessary skills • Differences in nonmonetary aspects of job
Opportunity Cost and Economic Rent • Opportunity cost is what that resources could earn in its best alternative use • Economic rent is that portion of a resource’s total earnings that is not necessary to keep the resource in its present use form of producer surplus earned by resource suppliers
Exhibit 3: Opportunity Cost and Economic Rent (a) All Resource Returns are Economic Rent • The supply of grazing land is shown by the perfectly inelastic vertical supply curve, indicating 10 million acres have no alternative use • Since the supply of land is fixed, the amount paid to rent the land has no effect on the quantity supplied: the land’s opportunity cost is zero and all earnings are economic rent • The fixed supply determines the equilibrium quantity of the resource, while demand determines the equilibrium price S Dollars per unit $1 Economic rent D 0 10 Millions of acres per month
Exhibit 3: Opportunity Cost and Economic Rent • At the other extreme is the case in which a resource can earn as much in its best alternative use as in its present use • the supply curve is perfectly elastic horizontal all resource returns are opportunity costs as shown by the shaded area • Here, the horizontal, perfectly elastic, supply determines the equilibrium wage while demand determines the equilibrium quantity • The more elastic the resource supply, the lower the economic rent as a portion of total earnings (b) All Resource Returns are Opportunity Costs Dollars per unit S $10 Opportunity costs D Hours of labor per week 0 1,000
Exhibit 3: Opportunity Cost and Economic Rent (c) Resource returns are divided between economic rent and opportunity cost • If the supply curve slopes upward, the resource supplier earns some economic rent and some opportunity cost • At a market clearing wage of $10, the pink shaded area identifies the opportunity cost and • the blue shaded area the economic rent • Both demand and supply determine the equilibrium price and quantity S $10 Dollars per unit Economic rent 5 D Opportunity costs Hours of labor per week 0 5,000 10,000
Marginal Revenue Product • Marginal product is the change in total product from employing one more worker and reflects the law of diminishing returns • Marginal revenue product is the marginal product of the resource multiplied by the product price
Marginal Workers Total Marginal Product Total Revenue per day Product Product Price Revenue Product (1) (2) (3) (4) (5) (6) 0 0 - $20 $0 - 1 10 10 20 200 $200 2 19 9 20 380 180 3 27 8 20 540 160 4 34 7 20 680 140 5 40 6 20 800 120 6 45 5 20 900 100 7 49 4 20 980 80 8 52 3 20 1040 60 9 54 2 20 1080 40 10 55 1 20 1100 20 11 55 0 20 1100 0 12 53 -2 20 1060 -40 Exhibit 4: Marginal Revenue Product • Here, marginal revenue product is the marginal product of the resource multiplied by the product price of $20, the marginal benefit from hiring one more worker • Note that because of diminishing returns, the marginal revenue product falls steadily as the firm employs additional units of the resource.
Marginal Workers Total Product Total Revenue per day Product Price Revenue Product (1) (2) (3) (4) = (2) (3) (5) 1 10 $40.00 400.00 $400.00 2 19 35.20 668.80 268.80 3 27 31.40 847.80 179.00 4 34 27.80 945.20 97.40 5 40 25.00 1000.00 54.80 6 45 22.50 1012.50 12.50 7 49 20.50 1004.50 -8.00 8 52 19.00 988.00 -16.50 9 54 18.00 972.00 -16.00 10 55 17.50 962.50 -9.50 11 55 17.50 962.50 0.00 Exhibit 5: Marginal Revenue Product for a Price Maker • If the firm has some market power over the price that it charges, the demand curve slopes downward and price must be lowered to sell more • The profit-maximizing firm should be willing and able to pay as much as the marginal revenue product for an additional unit of the resource • The marginal revenue product for the price maker declines because of the law of diminishing returns and because additional output can be sold only if the price is lower
Marginal Resource Cost • The additional cost to the firm of employing one more unit of labor • Since the typical firm hires such a tiny fraction of the available resources, its employment decision has no effect on the market price of that resource • Each firm usually faces a given market price for the resource and decides only on how much to hire at that price
y y a a d d r r e e p p r r e e k k r r o o w w r r e e p p s s r r a a l l l l o o D D Exhibit 6: Market Equilibrium For a Resource and the Firm’s Employment Decision In panel (a) the intersection of market demand and supply determines the market wage of $100 per day becomes the marginal resource cost of labor to the firm regardless of how many workers the firm employees. In panel (b) the marginal resource cost curve is shown by the $100 market wage. The marginal revenue product, or resource demand curve, is based on the firm being a price taker. In this case the firm will hire 6 workers per day. a) Market demand for factory workers b) Firm Resource demand Marginal revenue product = resource demand $200 $200 Resource supply Marginal resource cost = resource supply 100 100 0 0 E Workers per day Workers per day 6 10
Resource Employment • For all resources employed, the firm should hire additional units up to the level at which • Marginal revenue product = marginal resource cost, or MRP = MRC • Profit maximization occurs where labor’s marginal revenue product equals the market wage
Shifts in the Demand for Resources • A resource’s marginal revenue product consists of two components • The resource’s marginal product; two factors can cause this to change: • A change in the amount of other resources employed • A change in technology • The price at which the product is sold. One factor can cause this to change • A change in the demand for the product
Change in the Price of Other Resources • The marginal product of any resource depends on the quantity and quality of other resources used in production • Resources can be substitutes or complements • Substitutes • An increase in the price of one increases the demand for the other • A decrease in the price of one decreases the demand for the other
Change in the Price of Other Resources • Complements • A decrease in the price of one resource leads to an increase in the demand for the other • An increase in the price of one resource leads to a decrease in the demand for the other • More generally, any increase in the quantity and quality of a complementary resource boosts the marginal productivity of the resource in question • Alternatively, any decrease in the quantity and quality of a complementary resource reduces the marginal productivity of the resource in question
Changes in Technology • Technological improvements can boost the productivity of some resources but can make others obsolete • Development of computer-controlled machines increased the demand for computer-trained machinists, but decreased the demand for machinists without computer skills • The development of synthetic fibers – rayon and orlon – increased the demand for acrylics and polyesters, but reduced the demand for natural fibers
Change in the Demand for the Final Product • Because the demand is derived from the demand for the final output, any change in the demand for output will affect resource demand • For example, an increase in the demand for automobiles will increase their market price and increase the marginal revenue product of autoworkers and other resources employed by the automobile industry