ATMi
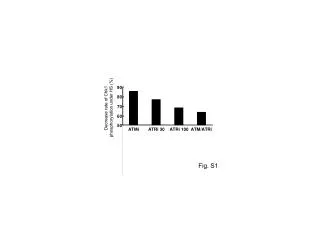
90. 80. 70. 60. 50. ATMi. ATRi 30. ATRi 100. ATM/ATRi. Decrease rate of Chk1 phosphorylation under HS (%). Fig. S1. Ctr. CGK733 20 m M. 4 .52%. 7 .63%. 0.08 %. 0 .69%. PI (FL4). 1.16%. 5 .48%. Annexin V-FITC (FL1). Fig. S2. A. SB218078 ( m M ). 5. 0. PI (FL4). B.

ATMi
E N D
Presentation Transcript
90 80 70 60 50 ATMi ATRi 30 ATRi 100 ATM/ATRi Decrease rate of Chk1 phosphorylation under HS (%) Fig. S1
Ctr CGK733 20 mM 4.52% 7.63% 0.08% 0.69% PI (FL4) 1.16% 5.48% Annexin V-FITC (FL1) Fig. S2
A SB218078 (mM) 5 0 PI (FL4) B Annexin V-FITC (FL1) SB218078 (mM) 0 0.5 1 2 SubG1 (%) 0.73% 1.78% 2.97% 6.60% Counts DNA content (PI; FL4) Fig. S3
CtrChk1i HS 30 HS 45 HS 45 + Chk1i HeLa HSC3 Counts PC3 DNA content (PI; FL4) Fig. S4
48 hr 24 hr A siCTRL siCTRL siChk1 siChk1 Chk1 GAPDH Chk1 / GAPDH 1.00 0.12 1.00 0.07 B siChk1 siCTRL HS - - + + C ** ** 15 60 10 G2/M cells (%) 40 SubG1 (%) 5 20 0 0 - - - - + + + + HS HS siCTRL siChk1 siCTRL siChk1 Fig. S5
Ctr HS HU RPA2 DAPI Fig. S6