Download
1 / 17
170 likes | 382 Vues
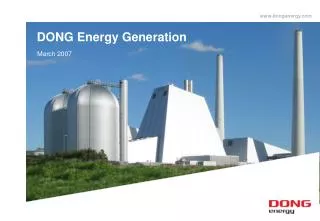
DONG Energy Renewables. Kim Ernst, Vice President DONG Energy International Paris 14-15 April 2008. DONG Energy at a glance. A leading utility company in the Nordic region. Market leader in gas supply and electricity generation in Denmark

E N D
DONG Energy Renewables Kim Ernst, Vice President DONG Energy International Paris 14-15 April 2008
DONG Energy at a glance A leading utility company in the Nordic region • Market leader in gas supply and electricity generation in Denmark • Direct natural gas market share of approx. 60% and equivalent 35% market share in Sweden • Leading power and heat producer in Denmark with a production capacity of approx. 5,500 MW. Renewables has additional capacity of 1,000 MW from wind turbines and hydro • Electricity supply to more than 1 million customers • Regulated infrastructure activities • Focused Gas E&P player with strong competencies • Owns 67 licences (end 2005) and is currently producing approx. 35,000 boe/day • Expected to increase to approx. 120,000 boe/day in 2010 Doc. info • Strong component of low risk, stable operating profits and conservative financial profile • Shift in focus towards consolidation and integration • Significant increase in EBITDA expected after 2007 due to Ormen Lange and synergies • Stable long-term majority ownership by Danish Government *) Unaudited figures based on Preliminary Combined “New Group” Financials
Highlights Strong integrated presence across natural gas and power value chains FY2007 Generation Distribution Markets E&P DKK 12.3bn (27%) DKK 4.5bn (10%) DKK 24.6bn (52%) Revenues(1) DKK 4.9bn (11%) DKK 3.7bn (37%) DKK 1.6bn (17%) DKK 2.2bn (22%) EBITDA(1) DKK 2.4bn (24%) Power distribution Offshore Wind Onshore Wind Hydro power Natural gas distribution Natural gas and/or power customers Central power plants Natural gas storage Focus areas Total RevenueFY2007:DKK 41.6bn Total EBITDA FY2007:DKK 9.6bn Note: 1. Based on Group FY2007 figures, percentage distribution calculated before eliminations and other unallocated items
DONG Energy Renewables Organisation and competences
Project Development Construction Production PROJEKTUDVIKLING • Market analyses and identification of potential sites • Acquisition of project rights • Partnering • Engineering and project planning • Procurement strategy and tendering • Planning of operating phase • Financing • Construction of production facilities • Project management • Power production • Operation and maintenance of assets Renewables’ core activities Doc. info
Current asset base of DONG Energy Renewables Wind farms All operating assets in Spain and Portugal – 216 MW wind and 25 MW hydro – together with a large pipeline of development projects were sold off in August 2007 due to a decision on strategic focus on Northern Europe Hydro power plants Assets under development or construction only Assets in operation and under development; wind and/or hydro power
Renewables is a major player among international utilities focusing on wind energy and is world leading within offshore wind energy Nysted Offshore Wind Farm The global offshore wind farms in operation Doc. info Source: BTM March 2005 , *Sold to Vattenfall
DONG Energy Renewables • DONG Energy is committed to developing projects in the UK with an extensive number of projects in the pipeline • Involved in 9 R1 & R2 projects (Barrow; Burbo; Shell Flat; Scarweather Sands; London Array; Walney; West of Duddon Sands; Gunfleet Sands I+II ) totalling 2830MW (DONG Energy share 1564MW) • Recently formed a joint-venture Channel Energy Ltd (with Farm Energy) developing two 1500MW offshore projects in the SW of England Doc. info
The permission and application process for erecting wind turbines in Zone de Développement Eolien (ZDE) Expected planning procedure ZDE Historic application proces Local accept, 4 years EIA 1 year Buildingpermit ½ year New application proces ZDE, 2 years EIA 1 year Building permit ½ year • ZDE defines areas where to build wind turbines in communes covered. Discussions with local administrations are reduced. • ZDE defines, e.g. maximum or minimum numbers of MW installed and turbine height in a given land area. • Grenelle is expected to reduce application time further, goal is 6 months • Environmental Impact Assesment (EIA) and building permit from local authorities still necessary Source: SER, March 2007 • March 2007, 15 ZDEs have been approved • 300 ZDE are applied for and the number is expected to increase fast among the more than 36,000 communes • Important to participate in or initiate ZDE process in areas with existing wind turbine development rights.
Key observations from offshore wind development activities Doc. info
Summary of key observations from offshore wind farm development • Observations from consenting activities in EU include: • Planning system is extremely complex • Consenting and EIA work takes 3-5 years! (e.g. bird survey work started on London Array in autumn 2002, consent by autumn 2007) • Costs up to £5m just for the consenting phase • No guarantee for consent, therefore a huge risk on the developer • Due to lack of data on the offshore environment, it is often a question about luck whether the site may have issues that could prevent consent to be granted • Risk of public inquiry which is costly and time-consuming - more than a year’s delay Doc. info
Summary of key observations cont'd • Need for a streamlined (“One-Stop Shop”) consenting process • Several regulators involved (national, county and local level), and they do not coordinate their permitting activities • Authorities are in general very flexible and obliging but deadlines are often exceeded by the authorities • Huge number of statutory consultees/stakeholders • Often expensive easements are required (i.e. crossing of railway can potentially cost several £m in easement) • NIMBYism is an issue even for remote offshore wind farms as onshore substations are required for large projects • Regulators on the local level are often not aware of the government targets Doc. info
Characteristics of the French offshore regime: • Penalizes high production over 2800 full load hours in the operating period from 10 to 20 years • the electricity price is fixed for 20 years, which means that the electricity cannot be sold at market price if this price should prove more advantageous • only 60% inflation are being covered in the tarif • the investor must cary the full grid connection costs • high corporate tax and reduced average tax depreciation Conclusion: • penalizes optimum production at good sites • results in an unprofitable investment climate • only few of the planned 4000 MW offshore will be established on the current commercial basis Doc. info
Electric cars can utilise excess wind power and recharge at night using cheap electricity • Electric cars make it possible to utilise more renewable energy • A single 2 MW wind turbine can provide 3,000 electric cars with energy • The electric cars will primarily be recharged at night when excess wind power production is often available • Batteries are four times more effective as an energy provider compared to hydrogen • Even if all electricity were provided solely by coal-fired power plants, the CO2 emission per car would be only 50% that of a traditional car • If 20% of the Danish vehicle fleet were electric cars, a CO2 reduction of 1.1 million tonnes per year could be achieved.