Download
1 / 80
800 likes | 988 Vues
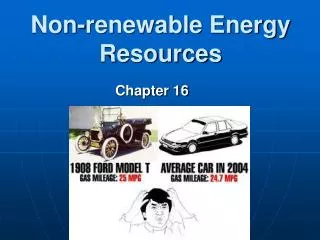
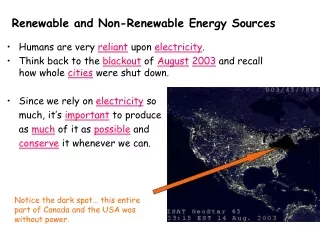
Energy - Introduction - Non-renewable - Renewables - Transportation. Energy trivia…. USA has 4.5% of the world’s population 25% of world’s commercial energy India: 16.4% of the population 3% of world’s commercial energy. United States. Energy Sources for Total US Energy Use. 40% Oil

E N D
Energy- Introduction- Non-renewable- Renewables- Transportation
Energy trivia… • USA has 4.5% of the world’s population • 25% of world’s commercial energy • India: • 16.4% of the population • 3% of world’s commercial energy
Energy Sources for Total US Energy Use • 40% Oil • 22% Coal • 22% Natural Gas • 7% Nuclear • 5% Hydropower, Geothermal, Solar • 4% Biomass
Energy Sources for Transportation Sector • 98% Oil • 2% Natural Gas and Electricity (from a variety of sources)
Electricity Energy Source http://www.eia.doe.gov/emeu/aer/pdf/pages/sec2_2.pdf
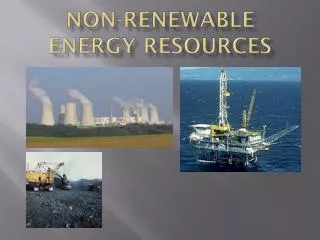
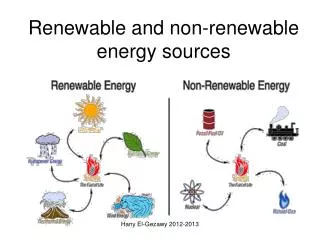
Nonrenewables Oil Coal Natural gas Nuclear Renewables Solar Wind Biomass Geothermal Hydroelectric What is it? Availability Cost Impacts Nonrenewable and renewable
Oil • Refining through distillation
Oil: Availability • Peak of oil production expected 2010-2030. • Some say it has already occurred • World oil economic depletion 2035-84 (27 to 76 years from now) • BUT: Oil use is growing (18% from 1990-2003)
United States production and consumption 56% imports in 2003
Proven oil reserves at end 2004 • ~2/3 of world’s reserves in the Middle East. • 20% of world’s reserves in Saudi Arabia. • 3% in United States
Oil: Maintaining Production? • New Oil Field Finds? • Oil Shale (or, heavy oil) • costs 75% more than pumped oil • mining waste, low net energy yield • Tar Sands • severe environmental problems, low net energy yield • New Technology to Exact more Oil from Existing Sites? • Some already in place now • Note: world production has increased <10% in the last two decades
Oil: Consequences Heidi Snell Oil spill off the Galapagos Islands 2001
Oil: Evaluation Availability and cost • Still available and cheap (sort of) and will be for short-term • probably not for mid-term • definitely not for long-term Net energy efficiency • High Environmental and other costs • Pollution (air and water) • carbon dioxide, NOx, SOx • Political dependence
COAL http://www.ohvec.org/galleries/mountaintop_removal/007/43.html
Coal: What is it? • Remains of buried swamp plants that have been pressurized over eons. • Largely carbon, with varying amounts of water and sulfur: • Lignite (brown coal) • low heat, low sulfur content • Bituminous coal (soft coal) • high heat, usually high sulfur content • Anthracite (hard coal) • high heat, low sulfur content
Coal: Supply Expectations • Identified coal reserves: • last 220 yrs at current rate of use • last only 65 yrs if rate rises 2% per yr • Unidentified coal reserves: • last 900 yrs at current rate of use • last 149 yrs if rate rises 2% per yr MOST ABUNDANT FOSSIL FUEL
Proved coal reserves at end 2004 • 66% world’s known reserves in : • United States (24%) • former Soviet Union • China • US anthracite: • only 2% of total
Coal: Cost • Cost • Low • However • many old coal-burning facilities • 45% of cost of new plant is environmental compliance
Coal: Environmental Impacts • Dirtiest fossil fuel • Mining effects: • Combustion Effects:
Coal: evaluation • Availability • High • Cost • Cheap without environmental controls • Getting more expensive • Environmental effects • HIGH
Conventional vs Unconventional NG vs Biogas • found with oil deposits = conventional • found by itself = unconventional • gas from biomass of recent origin = biogas • landfills, cows, termites, decomposition • methane
Proven natural gas reserves at end 2004 • 40% of known reserves in former Soviet republics • 6% of known reserves in US • In 2003 net imports of natural gas were ~15% of gas consumed
Other uses of natural gas • Chemical industry • Feedstock for ammonia, methanol, ethylene • Energy source • “US Government policy has somehow concluded that natural gas should be the burned fuel of choice. That is something the equivalent of burning rare mahogany rather than common pine.” • Andrew Liveris • CEO Dow Chemical California energy usage
Natural Gas: Availability • At PRESENT rate of use: • US conventional supplies: 65-80 years • World conventional supplies: 125 years • Unconventional supplies: >200 years • Rates increasing 2% per year • 200 year supply becomes 80 year supply
Natural Gas: Environmental Impacts • Cleanest of all fossil fuels
Natural Gas: • Availability: • Cost • Going up • Env effects • Clean for a fossil fuel, but still many issues
Nuclear Fission: Non-Renewable? • Conventional Nuclear Reactors: Splits uranium-235 • U-235 is just 0.7% of total U supply • U-238 is >99% of world’s U • Availability of U-235: 100-200 years • Other potential nuclear fission reactors: breeders reactors: could use U-238
The evolution of nuclear power • 1961: 1 • 1969: 25 • 1975: 31 • 1979: 20 • 1985: 14 • 1990: 3 No new plants licensed since 1978 April 9, 1979
Chernobyl, 1986 www.spaceman.ca/gallery/ chernobyl/CHERNOBYL_002
Can nuclear power ever be safe? http://www.angelfire.com/extreme4/kiddofspeed/chapter11.html
Nuclear waste • Low level waste • 100-500 y • High level waste • 100,000 – 240,000 y • Who has responsibility for waste in US??
Nuclear energy - evaluation • Availability: • Short term • Possibly renewable in long term • Cost • High, though promoted as cheap • Waste • No known safe storage • Efficiency • Low • Safety
Solar: types • Solar heating • Passive South >> If in northern hemisphere,
SOLAR: types Photovoltaics