Download
1 / 50
500 likes | 636 Vues
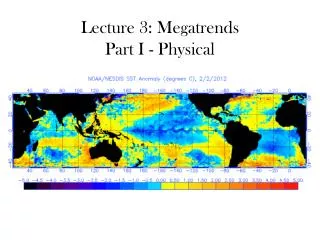
Lecture 3: Megatrends Part I - Physical. Solar irradiance Measured by satellites since 1970s and proxy measurements. The sun has a well-known eleven-year irradiance (W · m -2 ) cycle that produces a ~0.08% variation in output.

E N D
Solar irradiance Measured by satellites since 1970s and proxy measurements. The sun has a well-known eleven-year irradiance (W·m-2) cycle that produces a ~0.08% variation in output. Studies show that solar variability has played a role in past climate changes. For example, a decrease in solar activity is thought to have triggered the Little Ice Age between approximately 1650 and 1850. http://climate.jpl.nasa.gov/causes/
As part of its 11-year cycle, the sun is now ramping up, after an unusually long lull.
Solar irradiance Since 1750, the average amount of energy coming from the Sun either remained constant or increased slightly. Climate models that include solar irradiance changes can’t reproduce the observed temperature trend over the past century or more without including a rise in greenhouse gases. Warming is observed near the surface (greenhouse effect) rather than all layers of the atmosphere (which would indicate a contribution from solar activity).
Milankovitch cycles: Changes in the Earth’s, movement relative to the sun, have an effect upon climate. The episodic behavior of glacial and interglacial periods have primarily been caused by these cycles.
Eccentricity – (0.017) orbit about the Sun • 100,000 years
Obliquity – Earth’s tilt (23.44˚) • 41,000 years
Precession – Earth’s “wobble” • 23,000 years
Thermohaline (THC) • The cold salty water masses form in only two locations: • Greenland, known as the North Atlantic Deep Water (NADW) • Antarctica, known as the Antarctic Bottom Water (AABW) sea-to-air heat transfer Warm shallow current Cold, salty deep current
Wind-driven surface currents (e.g. Gulf Stream) head polewards from the equatorial Atlantic Ocean • Cooling all the while and eventually sinking at high latitudes (forming North Atlantic Deep Water). • This dense water then flows into the ocean basins. • The bulk of it upwells in the Southern Ocean. • The oldest waters (with a transit time of around 1600 years) upwell in the North Pacific
Younger Dryas – Implications for climate • 12,000 years ago Earth was beginning to warm at the end of the Wisconsin glacial age, but rapidly fell back into a 1300 year period of cold in the high latitudes. Some northern regions returned to peak ice age conditions. • The prevailing theory holds that the Younger Dryas was caused by a significant reduction or shutdown of the North Atlantic thermohaline circulation in response to a sudden influx of fresh water from Lake Agassiz and deglaciation in North America.
THC vs. MOC • Atlantic Meridional Overturning Circulation (MOC) • The MOC only occurs around the meridian - hence the name - and so is confined to the Atlantic Ocean • Published data on the MOC's existence, whilst the thermohaline circulation remains a purely theoretical conjecture
Atlantic Multidecadal Oscillation (AMO) • The AMO is an ongoing series of long-duration changes in the sea surface temperature of the North Atlantic Ocean, with cool and warm phases that may last for 20-40 years at a time and a difference of about 1°F between extremes. • The AMO index is correlated to air temperatures and rainfall over much of the Northern Hemisphere, in particular, North America and Europe. • It is associated with changes in the frequency of North American droughts and is reflected in the frequency of severe Atlantic hurricanes.
North Atlantic Oscillation (NAO) • The NAO is the dominant mode of winter climate variability in the North Atlantic region ranging from central North America to Europe and much into Northern Asia. • The NAO is a large scale seesaw in atmospheric mass between the subtropical high and the polar low. The corresponding index varies from year to year, but also exhibits a tendency to remain in one phase for intervals lasting several years.
NAO Positive Mode • The positive NAO index phase shows a stronger than usual subtropical high pressure center and a deeper than normal Icelandic low. • The increased pressure difference results in more and stronger winter storms crossing the Atlantic Ocean on a more northerly track. • This results in warm and wet winters in Europe and in cold and dry winters in northern Canada and Greenland • The eastern US experiences mild and wet winter conditions
NAO Negative Mode • The negative NAO index phase shows a weak subtropical high and a weak Icelandic low. • The reduced pressure gradient results in fewer and weaker winter storms crossing on a more west-east pathway. • They bring moist air into the Mediterranean and cold air to northern Europe • The US east coast experiences more cold air outbreaks and hence snowy weather conditions. • Greenland, however, will have milder winter temperatures
Arctic Oscillation (AO) • The Arctic Oscillation is a pattern in which atmospheric pressure at polar and middle latitudes fluctuates between negative and positive phases. • The negative phase brings higher-than-normal pressure over the polar region and lower-than-normal pressure at about 45 degrees north latitude. • The negative phase allows cold air to plunge into the Midwestern / Eastern US and western Europe, and storms bring rain to the Mediterranean. • The positive phase brings the opposite conditions. • The North Atlantic Oscillation is often considered to be a regional manifestation of the AO.
_ +
Pacific Decadal OscillationThe Pacific Decadal Oscillation (PDO) is a long-term ocean fluctuation of the Pacific Ocean. The PDO waxes and wanes approximately every 20 to 30 years.During a "warm", or "positive", phase, the west Pacific becomes cool and part of the eastern ocean warms; during a "cool" or "negative“ phase, the opposite pattern occurs
Pacific Decadal Oscillation Anomaly patterns in Wintertime SST Warm Phase Cold Phase
ENSO- and PDO-related climate anomalies share very similar spatial patterns over North America and the North Pacific Ocean. • Warm phase ENSO (El Niño) + PDO years >> • Winter seasons tend to be warm and anomalously dry in the Pacific Northwest causing reduced stream flow and snowpack • Coastal ocean temperatures are warmer than average all along the west coast of North America. • During cold phase ENSO (La Niña) years and negative PDO years, the opposite climate anomalies are typically observed.
Warm Phase PDO and ENSO. Note that the main center of warming for the PDO (left) is in the north Pacific, while the main warming of action for ENSO is in the equatorial Pacific (right).
ENSO 2010-2011 >> La Niña latest images from the OSTM/Jason-2 satellite
ENSO • The interaction of the atmosphere and ocean is an essential part of El Niño and La Niña events (the term coupled system is often used to describe the mutual interaction between the ocean and atmosphere). • During an El Niño, sea level pressure tends to be lower in the eastern Pacific and higher in the western Pacific while the opposite tends to occur during a La Niña. • This see-saw in atmospheric pressure between the eastern and western tropical Pacific is called the Southern Oscillation, often abbreviated as simply the SO .
ENSO • A standard measure of the Southern Oscillation is the difference in sea level pressure between Tahiti and Darwin, Australia. • Since El Niño and the Southern Oscillation are related, the two terms are often combined into a single phrase, the El Niño-Southern Oscillation, or ENSO for short. Often the term ENSO Warm Phase is used to describe El Niño and ENSO Cold Phase to describe La Niña.
For reference: December 2009 Eastward progression of a strong wave of warm water, known as a Kelvin wave
Past (2/2/2010) • El Niño is present across the equatorial Pacific Ocean. • Sea surface temperatures (SST) are 1.0ºC- 2.5ºC above-average across much of the central and east-central equatorial Pacific. • Based on current observations and dynamical model forecasts, El Niño is expected to continue at least into the Northern Hemisphere spring 2010. Latest weekly SST departures are: Niño 4 1.3ºC Niño 3.4 1.2ºC Niño 3 0.7ºC Niño 1+2 0.4ºC
The trade winds normally pile up warm surface water in the western Pacific while upwelling colder water in the east from below the surface along the equator and off the west coast of South America. During El Niño, the trade winds weaken along the equator as atmospheric pressure rises in the western Pacific and falls in the eastern Pacific. Anomalous warming in the central and eastern Pacific ensues as warm water in the western Pacific migrates eastward and upwelling is reduced
Typical US Temperature, Precipitation and Jet Stream Patterns during La Niña Winters
SST / SOI • Typically sea surface temperature (SST) in key regions of the equatorial Pacific are used to define "El Niño periods". • Alternatively an index known as the "Southern Oscillation Index" (SOI) is used based on the surface pressure difference between Tahiti and Darwin, Australia. • The advantage of the SOI is that records at those two locations go back a century, while we have only a few decades of SST observations in mid-ocean. • Then the correlation of one of these indices with, say, rainfall in California, is the basis for a forecast of the likelihood of reoccurrence of heavy rains in that region during an El Niño winter.
Temperature and SOI Nino 3.4 Sea Surface Temperature Index (departure from average) T The Southern Oscillation Index (Tahiti - Darwin) SOI http://iri.columbia.edu/climate/ENSO/background/monitoring.html
Tropical Atmosphere Ocean Array (TAO) In recent decades, indices based on sea surface temperature have come into common usage because satellites and an observing network of buoys in the equatorial Pacific now allow for collection real time, high quality data. The network of buoys referred to is the Tropical Atmosphere Ocean (TAO) Array.
Hurricanes Power Dissipation Index (PDI): An aggregate measure of Atlantic hurricane activity, combining frequency, intensity, and duration of hurricanes in a single index
Volcanoes Iceland's Eyjafjallajokull
Volcanoes • Particles and SO2 may reach the stratosphere, 22 km • Photo chemical conversion to SO4 aerosols • Transported globally, cools the surface, direct effect
Krakatoa • Debris encircled the equator over the next 13 days. • Global temperatures were lowered about 0.9°F (0.5°C), and did not return to normal until five years later. (Mt. St. Helen’s <0.2°F • Produced tsunamis’ as high as ~140 feet. • Perhaps twice as powerful as the largest hydrogen bomb - among the most violent volcanic events in modern and recorded history. • Edvard Munch’s The Scream
Mount Tambora • An active stratovolcano, also known as a composite volcano, on the island of Sumbawa, Indonesia. • Year Without Summer – 1816 • Eruption from Mt Tambora (1815) and solar activity assumed to be the culprit • It had roughly four times the energy of the 1883 Krakatoa eruption, meaning that it was equivalent to an 800 megaton explosion.
Reading Assignment • NH Winter 2009 and NAO