
Circle Graph Practice: Test Your Graph Skills with this Interactive Activity
Practice interpreting circle graphs with this engaging test. From percentages to quantities, analyze data and select the correct answers to improve your graph skills.


Circle Graph Practice: Test Your Graph Skills with this Interactive Activity
E N D
Presentation Transcript
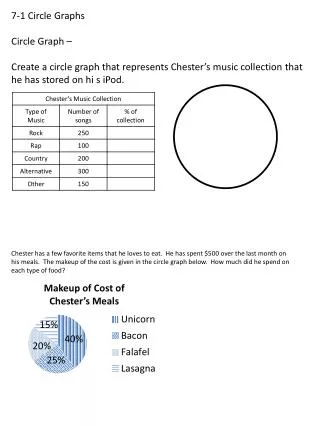
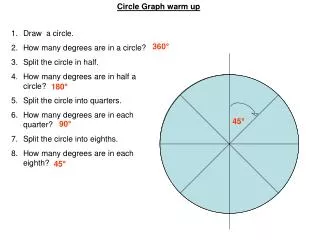
Circle Graph Practice Number a piece of loose leaf paper from 1 –12 on the front and 13 – 23 on the back. Read each question carefully. For each answer, you need to first write the letter of the correct answer. Then, you need to write a few words as to why that is the correct answer. Don’t forget to try the BONUS at the end! After the #1 slide, you will find the answer with a sample explanation.
#1 What percent of the students like tennis? a. 22% b. 18% c. 29% d. 13%
2. There were students surveyed on which sports they liked the best. Which two sports do about half of the students like best? • Wrestling and tennis • Tennis and chess • Baseball and football • Chess and wrestling
#3. Mick conducted a survey of the sport his classmates like the most. The table shows the results of the survey. Which circle graph correctly displays this information? a. Figure 1 b. Figure 2 c. Figure 3 d. Figure 1 &Figure 3
#4 The circle graph shows the percentages of ingredients used in the preparation of a pizza. Which ingredient is used in the lowest quantity in the preparation of the pizza?a. Mushroom b. Tomato sauce c. Cheese d. Crust
#5 The circle graph shows the total number of space vehicles that were sent into the space during 4 decades. How many more vehicles were sent during 1970 - 79 than that during 1960 - 69? a. 1035 b. 364 c. 308 d. 333
#6 The circle graph shows the number of people of different age groups, who visited a particular restaurant during a week. What percent of the people aged between 12 - 18 years visited the restaurant? a. 16.66% b. 8.33% c. 33.33% d. 22.22%
#7 Joseph earns $12000 per month. He constructs a pie chart based on his salary distribution. Which part of the circle graph shows the least consumption of his salary? a. Monthly Savings b. Household Expenses c. Taxes d. Miscellaneous
#8 The circle graph shows the sale of various brands of sneakers in a shoe store. Which brand shows the maximum sale? a. Reebok b. Nike c. Addidas d. Others
#9 A group of teenagers in school were surveyed about their favorite beverages. The result of the survey is represented on the Circle graph shown. If there were 28 teenagers who liked Pepsi most, how many liked Coke? a. 26 b. 16 c. 12 d. 14
#10 About what percent of the students liked the color red? a. 90 % b. 31 % c. 20 % d. 50 %
#11 The graph shows the monthly budget of Jason. How much more money does he spend on food than clothing?a. $400 b. $840 c. $200 d. $440
#12. In a survey of 60 students, 30 like vanilla, 20 like strawberry, and 10 like chocolate. Which of the graph best represents the data? a. Graph 1 b. Graph 3 c. Graph 4 d. Graph 2
#13. The graph shows the percent of each type of book in a library. What percent of the books are magazines in the library? a. 15% b. 12% c. 20% d. 10%
#14. Retailers were asked to name the technology they preferred for advertising. Which technology was most favored? a. Interactive b. Internet c. Interactive system d. Undecided
#15. Some of the fifth graders were surveyed about their favorite color. The graph shows the results of the survey. What percent of the students like the color pink? a. 10% b. 20% c. 30% d. 25%
#16. Students were surveyed about their favorite food. The results of the survey shown in the graph. What fraction of the students like pizza? a. 15% b. 13% c. 14% d. 12%
#17. Six girls paid a visit to a shopping mall. The amount spent by each of them are as follows.Keira spent $50.Henna spent $100. Sue spent $50.Mary spent $100.Diana spent $50. Curie spent $50.Which of the following graphs correctly represents the data? a. Figure 3 b. Figure 4 c. Figure 2 d. Figure 1
#18. Sally, Jamie, Ted, Tom, and Lawson had the shares of the total profit as represented in the graph. Which two people had a combined profit of about 50%? a. Ted and Jamie b. Lawson and Tom c. Sally and Tom d. Ted and Tom
#19. The table shows the consumption of electricity in metropolitan and other regions in a country. Which circle graph represents the data in the table? a. Figure 1 b. Figure 2 c. Figure 3 d. Both Figure 1 and Figure 2
#20. Which circle graph correctly displays the information shown in the table? a. Graph 3 b. Graph 2 c. Graph 4 d. Graph 1
#22 The data shows the amount of oil stock in a gas station. Which circle graph best displays the data shown in the table? a. Figure1 b. Figure 2 c. Figure 3 d. None
#23. Liza, Adam, Dawn, and Will collected marbles. The number of marbles collected by each one of them is as follows. Liza has 10 marbles. Adam has 6 marbles. Dawn has 2 marbles. Will has 2 marbles. Which circle graph best illustrates the marbles? a. Figure 2 b. Figure 3 c. Figure 4 d. Figure 1
BONUS!!!!!! Jim distributed chocolates among Jake, Bill, Joe and Paul. Jake got 15 chocolates, Bill got 18, Joe 21, and Paul 6. Which circle graph best represents the data? a. Graph 3 b. Graph 1 c. Graph 2 d. Graph 4
STOP The END!!!


![get [PDF] Download Circle Graph Paper: Circle Graph Paper Notebook for Beading D](https://cdn7.slideserve.com/12477208/slide1-dt.jpg)