Download
1 / 48
500 likes | 642 Vues
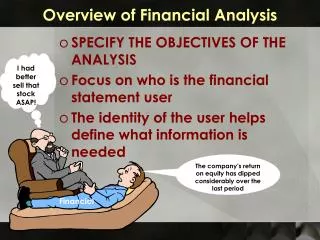
Overview of Financial Analysis. Rodney K. Rogers, Ph.D., CPA School of Business Administration Portland State University. Analyzing a Firm. Operations/Investing. $. Goods. Vendor. Customer. $. Goods. $. $. $. $. Information Intermediaries. Financial Intermediaries. Creditors.

E N D
Overview of Financial Analysis Rodney K. Rogers, Ph.D., CPA School of Business Administration Portland State University
Analyzing a Firm Operations/Investing $ Goods Vendor Customer $ Goods $ $ $ $ Information Intermediaries Financial Intermediaries Creditors Investors
External Parties Customers Employees Shareholders Firm Competitors Government Management Creditors Vendors
How does it get communicated? • Tell Them • Annual Report • Financial Statements, Footnotes, Management Disclosures (M.D.&A.) • Public Announcements, SEC Filings • Show Them • Financial Structure, Results • Problem:
Communication Issues • Managers have better information • “Information asymmetry” • Managers and external users have different interests – “Principal – Agent” • Management’s interests • Smooth earnings • Meeting expectations • Bonus issues
From Business Activities to Financial Statements Business Environment Business Strategy Business Activities Accounting Environment Accounting Strategy Accounting System Financial Statements
Analysis of a Company • Business Environment – “Context” • Macroeconomic, governmental, legal considerations, • Business Strategy Analysis – “Expectations” • Key profit drivers, business risks and profit potential • Accounting Analysis • Evaluate the “quality” of the accounting numbers • Financial Analysis • Evaluate performance using financial and non-financial information – (past and current results) • Prospective Analysis • Forecasts and valuation
SWOT Analysis • Internal • Strengths • Weaknesses • External • Opportunities • Threats
Business Environment • Interest Rates • US and foreign GNP Growth • Unemployment Levels • Trends in Consumer savings/borrowing • Others
Business Strategy Analysis • Specific Industry Structure • Rivalry among existing firms • Industry Growth, Concentration, Switching Costs, Fixed/Variable Costs, Excess Capacity • Threat of new entrants • Scale Economies, First mover, Relationships • Threat of substitute products • Price/Performance trade-off • Bargaining power of buyers and suppliers • Switching cots, number and volume of buyers/suppliers • Competitive Strategy • Cost Leadership • Differentiation
Competitive Strategy • Cost Leadership • Same product or service at lower cost • Economies of scale, efficient production, design • Differentiation • Unique product or service at a premium price • Product design, variety, customer service, brand, R&D, innovation • How to maintain competitive status?
Business Strategy Analysis • Quality of Management • Regulatory Developments • Social Issues • Technology
Review of Basic Financial Statements • Balance Sheet • Income Statement • Statement of Cash Flows • Retained Earnings Statement • Statement of Comprehensive Income
Analyzing a Firm Operations/Investing $ Goods Vendor Customer $ Goods $ $ $ $ Information Intermediaries Financial Intermediaries Creditors Investors
Accounting Analysis • Quality of Disclosures • Quality of Numbers
Quality of Numbers • Sales • Price vs. volume Charges • Real vs. nominal growth • Cost of Goods Sold • Cost-flow assumptions • LIFO liquidation • Loss/Reserves on write-down of inventory
Quality of Numbers • Operating Expenses • Discretionary expenses • R&D • Repair and Maintenance • Advertising and Marketing • Depreciation • Methods • Estimates • Pension Accounting
Quality of Numbers • Nonoperating Revenue and Expenses • Gains/Losses from Sales of Assets • Interest Income • Equity Income • Loss recognition on write-down of assets • Accounting changes • Extraordinary items • Reserves on restructuring charges
Financial Analysis:Levers for Value Creation Return on Equity = Net Income Shareholder’s Equity
Interrelationships of Ratios Return on = Profit Margin x Asset Turnover x Financial Equity Leverage • Change revenues • higher prices • greater volume • Change costs • product/process design • supply relationships net income = net income x sales x assets owner’s equity sales assets owner’s equity Advantageous financing (external) Reduce need for investment (capital intensity) Rev/Exp Assets Liabilities/Equity Managing
Managing Sales and Expenses • Gross Profit • Operating Profit • Issues to Consider • Price vs. Volume Changes • Real vs. Nominal Growth • Inventory Issues
Profitability Ratios Gross Profit Margin = Gross Profit Net Sales Operating Profit Margin = Operating Profit Net Sales Net Profit Margin = Net Earnings Net Sales
Profitability Ratios SGA % = Selling, General and Admin. Expenses Net Sales Return on Investment (ROI) = Net Earnings Total Assets Cash Flow Margin = Cash flow from operations Net Sales
Managing Assets Days in Receivables = Accounts Receivable Avg.Daily Sales A.R. Turnover = Net Sales Accounts Receivables Inventory Turnover = Cost of Goods Sold Inventory Fixed Asset Turnover = Net Sales Net Prop.Plant&Equip. Total Asset Turnover = Net Sales Total Assets
Managing Liabilities and Equity Current Ratio = Current Assets Current Liabilities Quick Ratio = Current Assets-Inventory Current Liabilities
Managing Liabilities and Equity Debt Ratio = Total Liabilities Total Assets L.T. Debt to Total Capital = LT Debt LT Debt + S.E. Debt to Equity = Total Liabilities Shareholders’ Equity Times Interest Earned = Operating Profit Interest Expense
Interrelationships of Ratios Return on = Profit Margin x Asset Turnover x Financial Equity Leverage • Change revenues • higher prices • greater volume • Change costs • product/process design • supply relationships net income = net income x sales x assets owner’s equity sales assets owner’s equity Advantageous financing (external) Reduce need for investment (capital intensity) Rev/Exp Assets Liabilities/Equity Managing
Market Ratios Earnings Per Share = Net Earnings Avg. Shares Outstanding Price to Earnings Ratio = Market Price of Common Stock Earnings Per Share Dividend Payout Ratio = Dividends Per Share Earnings Per Share Dividend Yield = Dividends Per Share Market Price of Common Stock
How Does a Firm Create “Value” for Its Investors? If a firm makes a profit has it created “value?” An investment creates value for its owners only when its expected return exceeds its cost of capital.
When is Value Created? By providing a return to investors that exceeds the cost of capital: Return on invested capital (ROIC): Return to Investors Invested Capital = ROIC (%) The value created for shareholders is: Return to Investors – Capital Charge = Value Added where Capital charge = Invested Capital × WAAC
How to estimate capital Capital can be estimated from the balance sheet (net assets): Net assets = Assets – Accounts payable (free financing) Assets = Left Hand Side of Balance Sheet = Cash + Accounts receivables + Inventory + Fixed assets + . . .
Value Added = Return to investors – Capital charge where... Return to investors = EBIT × (1 – tax rate) (EBIT stands for earnings before interest and taxes.) Capital charge = Capital × WACC Note: Return to investors is the same concept as Net Operating Profit after Taxes (NOPAT) Value added > 0 is equivalent to ROIC > WACC
The real point of the capital charge What can managers like you do to increase the CACC, and thus increase shareholder value? Value Added = EBIT(1-tax) - Capital Charge (Sales - COGS+SGA+Other) X (1-tax) Net Assets X WACC
Prospective Analysis • Forecast future results of firm’s transactions • Mean reverting, Business Environment, Business Strategy • Valuing a Firm • Discounted abnormal earnings • Price Multiples • Discounted cash flows • Weighted Average Cost of Capital (WACC)
Discounted abnormal earnings • Equity Value = Book Value + PV of expected future abnormal earnings • Future abnormal earnings = net income adjusted for a capital charge • Capital charge = Beginning book value X WACC
Price Multiples • Step 1 – select a measure of performance or value (ie. Earnings, book equity, etc) • Step 2 – Estimate price multiples for comparable firms • Step 3 – Apply the comparable firm multiple of the performance/value measure of firm being analyzed
Discounted cash flows • Equity value = PV of free cash flows to equity claim holders • Free cash flows to equity claim holders = operating cash flow – capital outlays + net cash flows from debt owners • Discounted at WACC
Are financial measures adequate? Should they be scrapped? Lagging or leading indicators? Management’s discretion
BalancedScorecard A multi-dimensional measurement system that translates an organization’s mission and strategy into goals/objectives and performance measures (with target levels)(Leading and lagging indicators)
BSC Structure Mission (serve customers well)Strategy (quality and features)Objectives (increased sales of new models)Measures (market share, cust. sat.)
Financial Perspective How do we look to our shareholders? Customer Perspective Business Processes How do we look to our customers? What business processes are the value drivers? Organization Learning Are we able to sustain innovation, change and improvement Balanced Business Scorecard Vision & Strategy
Customer Need Identified The Internal Business Process Perspective Post- Sale Service Process Operations Process Innovation Process Create Product/ Service Offering Customer Need Satisfied Build the Products/Services Deliver the Products/ Services Service the Customer Identify the Market 1-38 • 1996 Prentice Hall Business Publishing Management Accounting, 2nd ed., Atkinson, Banker, Kaplan, and Young
Financial Perspective Improve shareholder value? BusinessStrategy Customer Perspective Satisfy customer requirements? Internal Business Processes Best practices? INFORMATION TECHNOLOGY Learning and Growth Innovate, change, improve? Balanced Scorecard and Improved Performance
Performance Measures Financial“Has our financial performance improved?” What areour financialgoals? What customers do wewant to serve and howare we going to win andretain them? Customer“Do customers recognize that we are delivering more value?” VisionandStrategy Internal Business Processes“Have we improved key business processes so that we can delivermore value to customers?” What internalbusiness processesare critical to providingvalue to customers? Learning and Growth“Are we maintaining our ability to change and improve?”
BSC Linkages Financial Customer Internal/Business Process Learning and Growth ROE Customer Loyalty On-time Delivery Process Quality Process Cycle Time Employee Skills