New SNPs: Sift, Polyphen, etc.
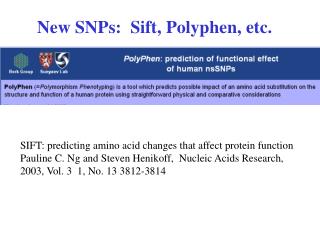
New SNPs: Sift, Polyphen, etc. SIFT: predicting amino acid changes that affect protein function Pauline C. Ng and Steven Henikoff, Nucleic Acids Research, 2003, Vol. 3 1, No. 13 3812-3814.

New SNPs: Sift, Polyphen, etc.
E N D
Presentation Transcript
New SNPs: Sift, Polyphen, etc. SIFT: predicting amino acid changes that affect protein function Pauline C. Ng and Steven Henikoff, Nucleic Acids Research, 2003, Vol. 3 1, No. 13 3812-3814
“Identification of BRCA1 missense substitutions that confer partial functional activity: potential moderate risk variants?”Lovelock, et al. 2007
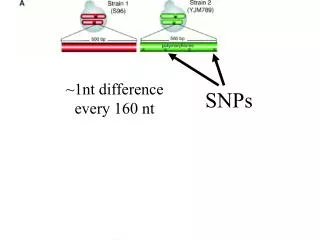
From SNPs to form &function:100% sequence identity, but different fold & function
Gene-Gene Interactions "Model...erythrocytes of [glutathione peroxidase] GPX1*2 heterozygotes should be more efficient in sheltering the cell membrane from irreversible oxidation and binding of hemoglobin caused by the oxidant stress exerted by Plasmodium falciparum... we observed a clear trend toward a dissociation between the HBB*A/*S and GPX1*2/*1 genotypes in the overall data." Destro-Bisol et al. Hum Biol 1999; 71:315-32. (Pub)
G6PD .. (food/drug induced hemolytic anemia) Malaria & HbS Thalassemia
Human Red Blood CellODE model ADP ATP 1,3 DPG NADH 3PG NAD GA3P 2PG 2,3 DPG FDP DHAP ADP PEP ATP ADP F6P ATP PYR R5P GA3P F6P NADH G6P GL6P GO6P RU5P NAD LACi LACe X5P S7P E4P ADP NADP NADP NADPH NADPH ATP GLCe GLCi Cl- 2 GSH GSSG GA3P F6P ADP K+ NADPH NADP pH ATP Na+ ADP HCO3- ADO AMP ADE ADP ATP PRPP INO IMP ATP ADOe AMP PRPP ODE model Jamshidi et al. 2000 (Pub) ATP INOe R5P R1P ADEe HYPX
Sickle cell Average HbSbE6VHbbE6W Modeling SNP to 3D to cell morphology & pathology Harrington et al. Crystal structure of deoxy-human hemoglobin b6 Glu --> Trp. Implications for the structure and formation of the sickle cell fiber. J Biol Chem. 1998, 273:32690-6. (Pub) Pro3
Red Blood Cell Function • Transport O2 from lungs to tissues – using hemoglobin to carry the O2 • Hemoglobin is maintained in its functional state (reduced) by the metabolic machinery • Cell membrane separates the internal environment from the external environment • subject to physicochemical constraints • Electroneutrality, Osmotic balance • Cause of the imbalance: • impermeable polyions inside the cell • hemoglobin, organic phosphates
3D-structure to function to morphology to function Normal RBC 6-8 µm; 4e12 per L Sickle cell; HbS Dacrocytes; pernicious anemia Acanthocytes; abetalipoproteinemia Echinocytes (crenated); hyperosmotic medium Macrocytes 9-12µm; megaloblastic anemia Spherocytes; enzyme deficiencies www.wadsworth.org/chemheme/heme/cytocritique
Ab Initio Structure Prediction: CASP4 (2 pt for largely correct prediction, 1 point for a somewhat) http://depts.washington.edu/bakerpg/
Where do 3D structures come from? Research Collaboratory for Structural Bioinformatics Protein Data Bank (RCSB PDB) HEADER COMPLEX (TRANSCRIPTION REGULATION/DNA) 23-NOV-93 1HCQ 1HCQ 2 COMPND 2 MOLECULE: HUMAN/CHICKEN ESTROGEN RECEPTOR; 1HCQ 4 REMARK 2 RESOLUTION. 2.4 ANGSTROMS 1HCQ 39 REMARK 3 PROGRAM 1 X-PLOR 1HCQ 42 REMARK 3 R VALUE 0.204 1HCQ 46 SEQRES 1 A 84 MET LYS GLU THR ARG TYR CYS ALA VAL CYS ASN ASP TYR 1HCQ 60 SEQRES 1 C 18 C C A G G T C A C A G T G 1HCQ 74 FORMUL 9 ZN 8(ZN1 2+) 1HCQ 107 FORMUL 10 HOH *158(H2 O1) 1HCQ 108 HELIX 1 1 GLU A 25 ILE A 35 1 1HCQ 109 ATOM 1 N MET A 1 50.465 24.781 79.460 1.00 60.88 1HCQ 133 ATOM 2 CA MET A 1 50.332 26.116 80.055 1.00 61.13 1HCQ 134 CONECT 2983 2747 2789 1HCQ4038 MASTER 22 3 8 9 8 0 0 6 3864 8 34 36 1HCQ4039 END 1HCQ4040
NMR distance-constrained ensembles Crystallographic phases & electron density Ca trace Ref1, 2
Crystallographic refinement Fourier transform relates scattered X-rays, F, to electron density, r. Dk is the scattering vector. Minimize Fo-Fc. Linearize with a first order Taylor expansion; parameters p (e.g. = x,y,z) (ref)
Crystallography & NMR System(CNS)X-plor Heavy atom searching, experimental phasing (MAD & MIR), density modification, crystallographic refinement with maximum likelihood targets. NMR structure calculation using NOEs, J-coupling, chemical shift, & dipolar coupling data. http://cns.csb.yale.edu/v1.0/
Measure Structure Quality R factor = S ||Fo|-|Fc|| / S |Fo| < 0.25 good > 0.4 crude Correlation Coefficient > 0.7 RMSD (root mean square deviation) = sqrt[S (Xi1 - Xi2)2 ] compare models 1 & 2 i = 1 to n (#atoms) canonical peptide geometry
20 Amino acids of 280 N CO R 19 L-amino acids: H toward you; CO R N clockwise. T www.people.virginia.edu/~rjh9u/aminacid.html www-nbrf.georgetown.edu/pirwww/search/textresid.html
Favored peptide conformations 3(10)helix fig
Molecular mechanics F = m a -dE/dri = Fi = mi d2ri/dt2 r = position (radius) dt ~= 1 fs (1e-15 sec) vi(t+dt/2) = vi(t-dt/2) + ai(t) dt update velocity & r ri(t+dt) = ri(t)= v(t+dt/2)dt E = Eb + Eq + Ew + Evdw + Eelectrostatic Eb = 0.5 kb(r-r0)2 Eq = 0.5 kq(q - q0)2 Ew = kw [ 1 + cos( n w - l)] Evdw = A(r/rv0)-12 -B(r/rv0)-6 Eelectrostatic = qi qj / e r b q w (Ref)