Download
1 / 23
230 likes | 384 Vues
Stephen H. Schneider* Melvin and Joan Lane Professor for Interdisciplinary Environmental Studies, Professor, Department of Biological Sciences Senior Fellow, Woods Institute for the Environment Stanford University [climatechange.net]

E N D
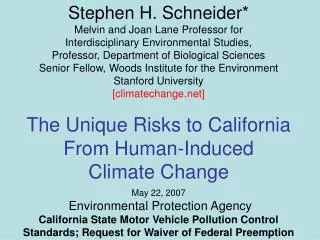
Stephen H. Schneider*Melvin and Joan Lane Professor for Interdisciplinary Environmental Studies,Professor, Department of Biological SciencesSenior Fellow, Woods Institute for the Environment Stanford University [climatechange.net] The Unique Risks to California From Human-Induced Climate Change May 22, 2007 Environmental Protection Agency California State Motor Vehicle Pollution Control Standards; Request for Waiver of Federal Preemption
Global Warming is Happening NOW: “Warming of the climate system is unequivocal, as is now evident from observations of increases in global average air and ocean temperatures, widespread melting of snow and ice, and rising global mean sea level (see Figure SPM-3). {3.2, 4.2, 5.5}.” IPCC, Summary for Policymakers, Contribution of Working Group I to the Fourth Assessment Report, February, 2007
Lyell Glacier • Yosemite National Park 1903 2003
“Very High Confidence”* Global Warming Impacts • North American Impacts Projected • Water Impacts: “Warming in western mountains is projected to cause decreased snowpack, more winter flooding, and reduced summer flows, exacerbating competition for over-allocated water resources.” IPCC, Summary for Policymakers, Working Group II Contribution to the Fourth Assessment Report, April, 2007 *Very High Confidence in the IPCC AR4 is defined as greater than 9 out of ten chance of occurrence
“Very High Confidence” Global Warming Impacts • North American Impacts Projected (cont’d) • Fire & Pest Impacts: “Disturbances from pests, diseases, and fire are projected to have increasing impacts on forests, with an extended period of high fire risk and large increases in area burned. “ IPCC, Summary for Policymakers, Working Group II Contribution to the Fourth Assessment Report, April, 2007
Wildfires Frequency increased four fold in last 30 years. Western US area burned Source: Westerling et al. 2006
“Very High Confidence” Global Warming Impacts • North American Impacts Projected (cont’d) Heat Wave/Public Health Impacts: "Cities that currently experience heat waves are expected to be further challenged by an increased number, intensity and duration of heat waves during the course of the century, with potential for adverse health impacts. The growing number of the elderly population is most at risk.” IPCC, Summary for Policymakers, Working Group II Contribution to the Fourth Assessment Report, April, 2007
Extraordinary & Compelling Conditions Hotter Days Lead to More Smog South Coast Air Basin Ozone Levels (1996-1999) Our Changing Climate: Assessing the Risks to California (2006), www.climatechange.ca.gov. Source: Air Resources Board, 2000
“Very High Confidence” Global Warming Impacts • North American Impacts Projected (cont’d) • Coastal Impacts: “Coastal communities and habitats will be increasingly stressed by climate change impacts interacting with development and pollution. Population growth and the rising value of infrastructure in coastal areas increase vulnerability to climate variability and future climate change, with losses projected to increase if the intensity of tropical storms increases. Current adaptation is uneven and readiness for increased exposure is low.” IPCC, Summary for Policymakers, Working Group II Contribution to the Fourth Assessment Report, April, 2007
We can Choose our Emissions Future(Intergovernmental Panel on Climate Change Emission Scenarios) Higher Emissions A1FI Medium-High Emissions Lower Emissions Just fossil fuel emissions shown in graphic.
We can Choose our Emissions Future(Intergovernmental Panel on Climate Change Emission Scenarios) CO2 tripling at 2100, then more CO2 doubling, then stabilized Higher Emissions A1FI Medium-High Emissions Lower Emissions Just fossil fuel emissions shown in graphic.
Calculating The Range of Warming Climate System Uncertainty Emissions Scenario Uncertainty Source: IPCC, WG 1, AR4, 2007
Warming Very Likely—But How Much?: Wide Range 6.4 C 1.1 C Source: IPCC, WG 1, AR4, 2007
Precipitation is generally considered to be more difficult to project with high confidence than temperature, but for a few regions the IPCC Working Group 1 found that over 90% of models agreed on the sign of precipitation changes (the stippled regions in the figures below). These regions are high latitudes--where precipitation increases appear to be a robust finding--and Mediterranean climates, like that of California, where decreased precipitation combined with higher temperatures are major concerns for water shortages, heat waves, wild fires and extreme air pollution events. In fact, as the second figure below shows—note circles around parts of California. California is unique in the United States in having such an unfortunate robust assessment for key vulnerabilities associated with drought and heat and air pollution.
Yes (unfortunately) in California Winter Summer
These precipitation figures above are for a middle emissions scenario (A1B) and thus there remains a substantial probability that the extent of these precipitation reductions could be much greater if the emissions of the future exceed those of A1B—for example, if the A1FI scenario occurred the results could be substantially amplified—a serious concern for risk management in California that has motivated the state to work hard to reduce emissions and thus lower the chance for the more catastrophic potential outcomes. Regardless of these precipitation projections, given that there is little precipitation in the summer in California and the warming projections are given with very high confidence in the assessments, there will be increased water stress and fires and air pollution even if the precipitation did not decrease as most models in the figures suggest. The potential impacts of such projected climate trends driven by emissions of greenhouse gasses are given in several figures below, emphasizing the “extraordinary and compelling” conditions that strongly support the case for a waiver for California on automobile emissions.
60 LOWER WARMING RANGE MEDIUM WARMING RANGE % CHANGE IN EXPECTED MINIMUM NUMBER OF LARGE FIRES PER YEAR 30 0 2035-2064 2070-2099 Increase in Wildfires Pollution in Plumes Source of data : Westerling and Bryant, “Climate change and wildfire in and around California: Fire modeling and loss modeling” (2006), www.climatechange.ca.gov
Extraordinary & Compelling Conditions More Smog Likely: Section 209(b) clearly covers this extraordinary and compelling condition Our Changing Climate: Assessing the Risks to California (2006), www.climatechange.ca.gov Data from GFDL B1 and A2 runs. SOURCE: Kleeman et al. 2006
summer Rising TemperatureEnd of Century Increases(Summer Average) F 18.0 LOWER EMISSIONS HIGHER EMISSIONS 16.2 14.4 12.6 10.8 9.0 7.2 5.4 3.6 1.8 summer 0.0 - 1.8 - 3.6 Notes: HadCM3 model results for 2070-2099 vs. 1961-1990. Higher emissions = A1fi; lower emissions = B1 scenarios from IPCC Third Assessment Report. Downscaled results from E. Maurer (http://www.engr.scu.edu/~emaurer/index.shtml).
summer Rising TemperatureEMISSIONS MATTER! F 18.0 LOWER EMISSIONS HIGHER EMISSIONS 16.2 14.4 12.6 10.8 9.0 7.2 5.4 3.6 1.8 summer 0.0 - 1.8 - 3.6 Notes: HadCM3 model results for 2070-2099 vs. 1961-1990. Higher emissions = A1fi; lower emissions = B1 scenarios from IPCC Third Assessment Report. Downscaled results from E. Maurer (http://www.engr.scu.edu/~emaurer/index.shtml).