Download
1 / 1
10 likes | 114 Vues
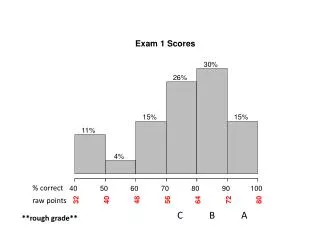
This study explores the distribution of exam scores and the correlation between raw points and final grades. It delves into the importance of correctly interpreting percentages and grades. Moreover, it analyzes the impact of various grading scales on student performance.

E N D
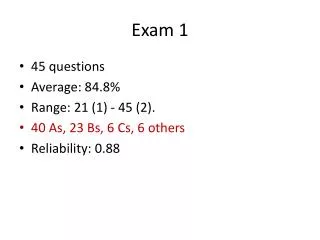
Exam 1 Scores 30% 26% 15% 15% 11% 4% % correct 40 50 60 70 80 90 100 48 56 64 32 40 72 80 raw points C B A **rough grade**