Solid Solution Thermal Equilibrium Diagram
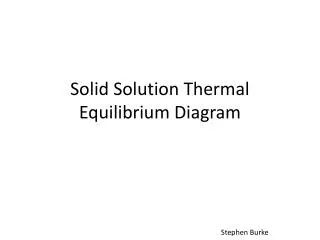
Solid Solution Thermal Equilibrium Diagram. Stephen Burke. 650. 630. 618. 603. 600. Liquid. 580. Liquidus Line. 552. 550. 524. 510. 500. 492. Label as A. Label as B. Label as C. Pasty. 449. 445. 450. B. A. C. 404. 400. 400. 368. For the alloy of 50% B

Solid Solution Thermal Equilibrium Diagram
E N D
Presentation Transcript
Solid Solution Thermal Equilibrium Diagram Stephen Burke
650 630 618 603 600 Liquid 580 Liquidus Line 552 550 524 510 500 492 Label as A Label as B Label as C Pasty 449 445 450 B A C 404 400 400 368 For the alloy of 50% B determine from the diagram the ratio of phases at 400°C. 350 340 332 Temperature °C Solidus Line 318 300 300 280 272 270 250 Draw Y-axis to represent Temperature 200 Draw line across from 400 °C 150 Solid Draw X-axis to represent Composition Draw line up from 50% 100 30 19 50 90 10 20 30 40 50 60 70 80 100 % Metal B AB BC Weight of Solid Weight of Liquid 30 19 = =