Download
1 / 26
260 likes | 619 Vues
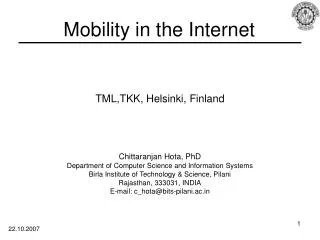
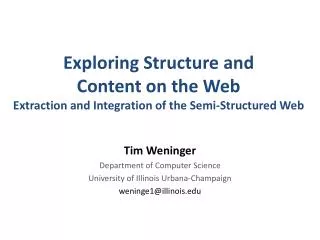
Neutron spectroscopy for analysis of dynamics of polymers and proteins: A view of a neutron user. Alexei Sokolov Department of Polymer Science, The University of Akron, Akron, OH 44325-3909 E-mail: alexei@uakron.edu. Outline. 1. Introduction. Frequency map of polymer dynamics.

E N D
Neutron spectroscopy for analysis of dynamics of polymers and proteins: A view of a neutron user. Alexei Sokolov Department of Polymer Science,The University of Akron, Akron, OH 44325-3909 E-mail: alexei@uakron.edu Outline • 1. Introduction. Frequency map of polymer dynamics. • 2. Advantages of neutron scattering spectroscopy • 3. Polymer dynamics, a few examples: • Fast dynamics: cooperativity of molecular motion; • Microscopic details of segmental and secondary relaxations; • Rouse dynamics and reptation regime. • 4. Protein Dynamics: • Dynamic transition in proteins and DNA; • Separating global and local dynamics. • 5. Concluding Remarks and Future Expectations.
Rouse and terminal relaxation Structural relaxation, a-process Vibrations FREQUENCY, n Secondary relaxations Fast relaxation 10-2 1 102 104 106 108 1010 1012 1014 Hz Dielectric Spectroscopy, e*(n) Quasi-optics,TDS Traditional dielectric spectroscopy IR-spectr. Light Scattering, Iij(Q,n) Interferometry Photon – Correlation Spectroscopy Raman spectroscopy Spin-Echo High-Resolution IXS Inelastic X-ray Scattering, S(Q,n) Neutron Scattering, S(Q,n) Back-sc. Time-of-Flight Frequency map of polymer dynamics Scattering techniques have advantage due to additional variable – wave-vector Q
Time-Fourier transform of I(q,t) gives dynamic structure factor: There are coherent and incoherent S(q,w): These equations were first introduced by van Hove [van Hove, Phys.Rev. 95, 249 (1954)]. Time-Space Correlation Function In an isotropic medium, time-space pair correlation function: presents coordinate of all atoms at time t. where G(r,t) has self and distinct part, G(r,t)=GS(r,t)+Gd(r,t). If at time t1=0 a particle was at position r1=0, GS(r,t) gives a probability to find the same particle around position r at time t, and Gd(r,t) gives a probability to find another particle around position r at time t. Intermediate scattering function is a space-Fourier transform of G(r,t): Definition from quantum mechanics:
Scattering from translation, rotation and conformation-jump motions • If atoms change their position: • I(q,t) decays with a rate that is inversely proportional to characteristic relaxation time of the motion t; • S(q,w) has quasielastic component (broadening of the elastic line) with the width inversely proportional to t. Depending on type of motion, elastic component can be present. Scattering from molecular vibrations • If atoms oscillate around fixed positions: • intermediate scattering function I(q,t) has oscillating component; • the dynamic structure factor S(q,w) has an inelastic component shifted in energy DE=ħw. Also significant elastic component is present.
Computer simulations of Ribonuclease A, 100 ps trajectory, Dr. M.Tarek
Each atom has coherent scoh and incoherent sinc cross-section. They define the dynamic structure factor: Scoh(q,w)scoh and Sinc(q,w)sinc. Hydrogen atom has sinc ~40 times larger than most of other atoms. As a result, motion of H-atoms give the main contribution to incoherent scattering spectra of polymers. Neutron Scattering Spectroscopy • Advantages: • measures atomic motion directly, results can be directly compared to different models; • usually wavelength l~1-10 Å, i.e. of the order of interatomic distances, that provides detailed information on coordinates of atomic motion; • reasonable resolution in time (frequency); • strong scattering by hydrogen atom, possibility for hydrogen/deuterium contrast • Disadvantages: • only a few spectrometers are available in National Labs (NIST, ANL, ONL, LANL, …); • weak signal and poor statistics; • many corrections are needed for data analysis.
An example of elastic scan measurements of PI [Frick, Fetters, Macromol. 27, 1994]. Decrease of elastic intensity marks onset of a relaxation process. Various deuteration of the polymer allows separate methyl group and main-chain motion. The onset of methyl groups rotation at temperatures below Tg is clearly seen. PI-d3 PI-d5 PI-h8, PI-d8 with all H substituted by D. PI – d3 PI – d5
Neutron scattering data for crystalline and glassy samples. The boson peak appears in all glassy samples [Malinovsky, et al. Europhys.Lett. 11, 43 (1990)]. glass As2S3 crystal Moreover, the shape of the boson peak appears to be universal in most of low-molecular weight systems. glass 1-As2S3 2-SiO2 3-Mg70Zn30 SiO2 crystal glass Mg70Zn30 0 1 2 E/Emax crystal Collective Vibrations, The Boson Peak The low-frequency, so-called boson peak (the name came from trivial Bose-statistics) has been observed in light and neutron scattering spectra of all glass forming systems. Different model estimates suggest that ~30-100 atoms are involved in this oscillations.
Static Structure Factor inter-molecular peak intra-molecular peak Presence of oscillations in S(Q,E) at Q~1.5 A-1 suggests that inter molecular cooperativity is involved in the vibrations at the boson peak (E~1-2 meV). No inter-molecular cooperativity is observed at higher E~6 meV. Data from [Buchenau, et al. PRL 77, 4035 (1996)] Q Boson peak energy The second peak (intra-molecular) is observed also at higher E. It means that atoms make coherent oscillations along the chain [Sokolov, et al. PRE 60, R2464 (1999)]. Cooperativity of molecular motion, example of poly(butadiene) For incoherent motion of atoms S(Q,E)~Q2 For cooperative motion S(Q,E)~S(Q)*Q2. DC=CD -D2C CD2- monomer of deuterated PB
Presence of oscillations in S(Q,E) suggests that the fast picosecond relaxation also involves a coherent motion of neighbor chains. Data from [Buchenau, et al. PRL 77, 4035 (1996)] Similar analysis has been done earlier for silica glass [U.Buchenau, et al., PRL 60, 1318 (1988)]. It reveals essentially no oscillation at the first peak and strong oscillations at the second peak in S(Q,E) for the boson peak vibrations (E~1 THz). Surprisingly, the same Q-dependence is observed for the quasielastic scattering (E~220 GHz). These data, as well as the data for PB reveal a strong similarity in eigen-vector of the boson peak vibrations and the fast picosecond relaxation. Fast relaxation Fast picosecond relaxation Quasielastic scattering (QES), i.e. relaxation-like contribution dominates S(Q,E) of PB at room T.
Relaxations (quasielastic scattering) Vibrations (inelastic scattering) • Susceptibility presentation of relaxation spectra (here n(n)=[exp(hn/kT)-1]-1 is the Bose factor) is very useful and has a few advantages: • can be compared to e”(n), G”(n); • each relaxation process appears as a maximum at 2pnt~1; • slopes of the tails give estimate of stretching exponents. Analysis of Quasielastic (Relaxation) Spectra: S(Q,E) vs c”(Q,E) The quasielastic scattering (a relaxation-like contribution) usually dominates the spectra at higher T. It is traditionally approximated by a sum of a few Lorentzians. This approximation assumes a few single exponential relaxation processes. This assumption, however, can lead to misleading results. Recommendation: Analyze the susceptibility spectra before any fits!
Inter-molecular vs Intra-molecular relaxations Analyzing scattering function (S(Q,E) or S(Q,t)) at particular Q of interest (inter-molecular peak or intra-molecular peak) provides information on a type of motion. Neutron spin-echo measurements on PB demonstrate [Arbe, et al. PRB 54, 3853 (1996)] that decay at Q=1.5 Å-1, measured at different T, scales well with the viscosity shift factor, i.e. with time scale of segmental relaxation. It means that the motion of neighbor chains (one relative to another) is the primary contribution to the structural (a-) relaxation. No master curve is observed for Q=2.7 Å-1. Decay at Q=2.7Å-1 scales with b-relaxation temperature dependence. Thus the segmental relaxation is a cooperative process that involves a few neighbor chains. In contrast, the b-process in PB has rather intra-molecular origin.
Colmenero, et al. [J.Phys.Cond.Matter 11, A363 (1999)] considered Q-dependence of the intermediate scattering function for both scenarios: Heterogeneous: Homogeneous: Experimental data at high temperatures agree better with the homogeneous scenario! Deviations at higher Q is explained by a jump distance.The analysis of the data for many polymeric and small molecular systems reveals the same trend: tQ-2x/b, gives x~1 (homogeneous) rather than x~b (heterogeneous). Dynamic Heterogeneity Stretched exponential relaxation, S(Q,t)exp[-(t/t)b], is typical for liquids, glasses, polymers and proteins. There might be two reasons: (1) Heterogeneous - relaxations are exponential, but have a distribution of relaxation times; (2) Homogeneous - each process decays non-exponentially.
CH3 -C-CH2- CH3 220 K 280 K 260 K Moreover, direct comparison of the results to a model of the methyl group rotation (solid lines) and to the model of a two-site jumps (dash lines) demonstrates better agreements with the latter. Thus, the secondary relaxation in PIB is a conformational jump that involves also methyl groups. 280 K Secondary relaxation in poly(isobutylene) (PIB) monomer has two methyl group According to NMR, the secondary relaxation was ascribed to the methyl group rotation. Analysis of elastic incoherent structure factor (EISF) [Arbe, et al., Macromol. 31, 4926 (1998)] reveals jump distance d~2.7 A-1, that is too large for a methyl rotation.
Temperature variations of the elastic intensity (really elastic and unresolved quasielastic) provides information on distribution of energy barriers for the relaxation process. Here, A characterizes the fraction of unresolved quasielastic scattering. It depends on distribution of barrier heights: The authors [Arbe, et al., Macromol. 31, 4926 (1998)] took the parameters from an earlier analysis of dielectric relaxation data (s=130-0.29*T meV, E0~260 meV) and demonstrate a good agreement.
Polymeric system Additional force appears in a polymer due to chain connectivity. Rouse model assumes Gaussian statistics of the chain and: It predicts: <x2>~t0.5 Motion of a segment in a polymer melt: Rouse dynamics System of small molecules x is a friction, f(t) is a random force. Brownian motion
The characteristic decay rate W=t-1 varies Q4, and the stretching parameter b~0.5, in agreement with the predictions of the Rouse model. According to the Rouse model, Here, l is a segment length, W is a friction term. Neutron spin-echo results on partially deuterated PDMS [Ewen, Richter, Adv.Polym.Sci. 134, 1 (1997)] show good scaling with the Rouse variable Q2t1/2. No adjustable parameters have been used to scale data measured at different Q.
Intermediate scattering function first decays according to the Rouse regime (the solid lines), but then decay becomes slower [Wischnewski, et al. PRL 90, 058302 (2003)]. Mean-squared displacement follows the predicted behavior. The inflection point gives microscopic estimate of the tube diameter d. It differs from viscoelastic estimates [Wischnewski, et al. PRL 90, 058302 (2003)]. PEP PE Reptation When polymer chains are long, their motion is additionally restricted by entanglements with other chains. Reptation model describes a segment diffusion as a motion in a tube with a diameter d of the order of the distance between entanglements. It predicts <r2>t1/2 (Rouse regime) at short time scale and distance and much slower <r2>t1/4 at r>d.
Dynamic Transition in Biopolymers Mb It has been found that functions of proteins slow down significantly around the temperature of a dynamic transition. The dynamic transition appears as a qualitative change of the temperature variations of mean-squared atomic displacements <x2>. Mean-squared displacements, <x2>, in Mb and escape fraction of CO from Mb, NS. Data from Lichtenegger, et al. Biophys.J. 76, 414(1999).
Lysozyme in glycerol Myoglobin wet wet dry dry in trehalose Dynamic transition in hydrated proteins appears at T~200-230K. It is suppressed in dry proteins and in proteins embedded in trehalose [L.Cordone, et al. Biophys.J. 76, 1043(1999)]. It is shifted to higher T~270-280K in protein placed in glycerol [Tsai, et al. Biophys.J. 79, 2728 (2000)]. Usual interpretation of the dynamic transition is a sudden increase in anharmonicity of internal protein motion. The main problem is that <x2> is an integrated quantity and does not bring details of the molecular motion. What is happening at the dynamic transition? what kind of motion is activated above Td? One can gain better insight using experiments that provide time or frequency resolved information. Neutron scattering is at present one of the best techniques for this research.
DNA/D2O, Back-Scattering Data DNA Measurements on back-scattering spectrometer show strong broadening of the quasielastic spectra in hydrated DNA at T>210K ~TD. No significant broadening is observed in dry DNA even at T=315K. Thus, the dynamic transition in hydrated DNA is related to the slow relaxation process that appears in the GHz-frequency window at T>210K [Sokolov, et al. J.Biological Physics 27, 313 (2001)].
DNA/D2O TOF data lead to the same conclusion: The slow process depends strongly on T and humidity. It does not appear in the spectra of the “dry” sample even at the highest T=320K. It appears in the spectra of the “wet” samples at temperatures above the dynamic transition, T>Td.
Width of the second (broad) Lorentzian shows weak Q-dependence. That corresponds to a local motion. G of the local motion differs for protein in solutions and in powders. Dynamics of proteins in solution and in powders [Perez, et al. Biophys.J. 77, 454 (1999)] The spectra are fit by a few Lorentzians Spectra of protein solutions (after solvent scattering subtraction) show narrow component with the width GQ2. It corresponds to a protein diffusion.
One of the main problem with neutron scattering measurements of dynamics in biological objects is rather large sample quantity (~0.5 g) required for an experiment. Recently, Doster, et al. [Physica B 301, 65 (2001)] proposed to use elastic resolution spectroscopy to study motions in small biological samples. They measure elastic scattering intensity and time variations were introduced by varying the width of the resolution function. In this way they were able to measure 23 mg of hydrated Mb.
Concluding Remarks Neutron scattering spectroscopy is very effective technique for analysis of molecular dynamics. It provides details of molecular motion not accessible to many other methods. The main advantage of neutron scattering is ability to provide information on space-time correlation functions at Å length scale. • A few examples: • Measurements of vibrational density of states; • - Separation of inter- and intra- molecular motions; Coherent inter- or intra- molecular dynamics; • Using H/D exchange, it is possible to find out which part of the molecule is involved in a particular motion. Neutron spectroscopy is relatively complicated and time consuming, it might be very frustrating at the beginning. But it can be very rewarding at the end.
That will provide faster and more accurate measurements. It will require less sample (extremely important for biological samples). More direct comparison with computer simulations, modeling of molecular motion. Special software will be available for general users. And many more … and Future Expectations Start of Spallation Neutron Source (SNS) (~2006-2007) will bring more effective spectrometers. In particular, TOF spectrometer is expected to be ~100 times more effective. Acknowledgments: financial support from NSF, DMR-Polymer program