Download
1 / 41
410 likes | 557 Vues
Welcome to the 3rd Annual System Review NOAA Climate Observation Program 25-27 April 2005 Silver Spring. Welcome. NOAA Leadership Project Managers, Data Providers Data Users Program Managers Partner Programs - National & International Climate Observing System Council

E N D
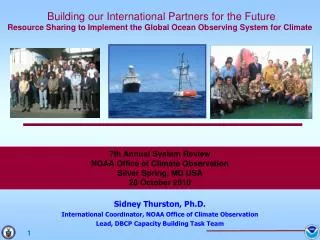
Welcome to the 3rd Annual System Review NOAA Climate Observation Program 25-27 April 2005 Silver Spring
Welcome • NOAA Leadership • Project Managers, Data Providers • Data Users • Program Managers • Partner Programs - National & International • Climate Observing System Council • JCOMM Observations Coordination Group • Friends of the Observing System
Logistics • Travel and Administrative support • Gina Galo • Meeting organization • Diane Stanitski -- overall • Silvia Garzoli -- science sessions • Candyce Clark -- JCOMM OCG • IT support • Todd Pearce • Annual Reports • Fed Ex boxes -- yellow stickies • Ice Breaker • Metro ticket -- $5 bill -- Diane • Meet in lobby at 1800 • Round tables in poster room • Posters and abstracts
Agenda • Monday • Welcome and Overview • Science of the observing system • Ice Breaker at the Capitol City Brewing Company • Tuesday • Science of the observing system • Discussion and Recommendations • Reception in the poster room • Wednesday • Partnerships and Programmatics • COSC open session ……………..….….… • COSC executive session …………………….……. • Thursday • JCOMM Observations Coordination Group ……. • Friday until noon • JCOMM OCG All COSC OCG
JCOMM Observation Program Area • Achieving global coverage by the in situ networks • System-wide monitoring and performance reporting • Funding to meet implementation targets -- a Global Observing System cannot be built with existing resources. Same Goals and Priorities OCO Climate Observation Program
Congratulations! 51%
Statement by the President, 20 September 2004, The White House • “We have created a new integrated ocean observing system with international partners.” • NOAA Annual Guidance Memorandum for FY 2005: • “The Integrated Ocean Observing System (IOOS) must be developed as a major component of the U.S. contribution to GEOSS.” • GOESS 10-Year Implementation Plan Reference Document: • “Support implementation of actions called for in GCOS Implementation Plan.”
GEOSS Implementation PlanReference Document:The Ocean Baseline • October 2004 --- GCOS Implementation Plan for the Global Observing System for Climate in support of the UNFCCC (GCOS-92): • The system put in place for Climate will also support global weather prediction, global and coastal ocean prediction, marine hazards forecast and warning system, marine environmental monitoring, many other non-climate users.
Office of Climate Observation Mission Build and sustain a global climate observing system that will respond to the long-term observational requirements of the operational forecast centers, international research programs, and major scientific assessments.
Objectives • Document long term trends in sea level change • Document ocean carbon sources and sinks • Document the ocean’s storage and global transport of heat and fresh water • Document the ocean-atmosphere exchange of heat and fresh water
International Partnerships • are Central A global system by definition crosses international boundaries. All of NOAA’s global contributions are managed in cooperation with the Joint WMO/IOC Technical Commission for Oceanography and Marine Meteorology (JCOMM) -- presently 64 nations.
Global Ocean Observing System for Climate Now 51% complete. GCOS-92 Sea Surface Temperature, Sea Surface Height, Surface Vector Wind, Sea Ice, and Ocean Color from Space Tide Gauge Network 58 % complete 3˚x3˚ Argo Profiling Float Array 52% complete 5˚x5˚ Surface Drifting Buoy Array 79 % complete Moored Buoy Existing Planned Ocean Reference Station Existing Planned High Resolution XBT and Flux Line Existing Planned Frequently Repeated XBT Line Existing Planned Carbon Inventory & Deep Ocean Line Global Survey @ 10 years
Multi-Year Program Plan 2001 2002 2000 2003 2004 2005 2006 2007 2008 2009 2010 Real-time Stations Initial GCOS Subset 170 155 140 125 Tide Gauges 113 101 89 89 91 51 56 1250 1250 1250 1250 1250 1250 779 787 807 671 Number of buoys 975 Surface Drifting Buoys 119 97 104 115 Number of moorings 84 87 Tropical Moored Buoys 77 77 79 79 79 High resolution and frequently repeated lines occupied 51 51 51 45 34 28 Ships of Opportunity 27 26 26 24 23 3000 3000 3000 3000 3000 Number of floats 544 20 31 2300 Argo Floats 1500 923 Number of observatories, flux, and ocean transport stations 89 49 42 78 41 60 15 37 35 29 Reference Stations 54 Ice buoys, drifting and Moored stations 85 31 78 64 29 29 30 30 Arctic System 54 37 34 31 Repeat Sections Committed, One inventory per 10 years 31 31 29 1 Ocean Carbon Network 0 0 27 27 24 24 830 830 730 340 Days at sea (NOAA contribution) Dedicated Ship Time 640 531 370 370 497 497 497 9 Product evaluation and feedback loops implemented (NOAA contribution) 9 9 9 3 8 2 System Evaluation 7 0 1 1 Initial Ocean Observing System Milestones including international contributions 100 System % Complete 88 77 45 40 34 30 66 Total System 55 53 Base Budget FY 06 President’s Budget Planning, Unfunded 48 2001 2002 2000 2003 2004 2005 2006 2007 2008 2009 2010
Implementation CEFAS WHOI PMEL LDEO JCOMM OPS UW OCO ETL NCEP JCOMM 64 Nations NCDC SAI CO-OPS SIO FSU NDBC AOML BBSR UH UM 19 Centers of Expertise 151 People • In Situ System Funding: • 45% External • 41% OAR Labs • 10% NWS • 03% Private • 01% NESDIS + NOS • PBA budget: $43.5 million. • OCO managed budget: • $23.6 million • 104 funded projects RGOOS
Challenge: Deploy and maintain a sustained array of 1250 surface drifting buoys Major Milestone Drifter #1250 September 2005 79 % complete Target: 1250
Challenge: Extending the tropical moored buoy network across the Indian Ocean TAO/TRITON PIRATA 68% complete • CLIVAR/GOOS Initial Indian Ocean • moored array design • Japan - 2 existing TRITON sites • India-USA deployed 4 ATLAS moorings November 2004
AX03 PX38 AX10 AX07 PX37 PX40 AX20 PX44 PX10 AX34 PX18 AX11 PX21 PX11 PX31 IX10 PX04 AX29 IX09 AX08 PX13 PX05 AX15 IX08 IX07 PX17 PX02 IX06 IX12 PX09 PX81 IX01 IX22 PX08 PX06 PX30 IX15 IX21 AX18 PX50 PX34 SOOP: January-June 2004 Well sampled Over sampled Partially sampled Under sampled Not sampled HDX Not sampled FRX AX25 IX28 AX22 PX36 Challenge: Occupy 51 Ship-of-Opportunity High Resolution and Frequently Repeated XBT lines 24000 XBTs required per year 18337 Present drops per year 5663 Additional XBTs needed 53 % complete
Challenge: Achieve a global array of 3000 profiling floats 52% complete
35% complete NOAA Contributions NOAA Future Challenge: Deploy and maintain 89 Ocean Reference Stations.
Challenge: 10-year repeat Global Ocean Carbon Inventory and Deep Ocean Survey
Challenge: design a pCO2 observing system for seasonal variability The Existing System 17 programs in the Atlantic 9 programs in the Pacific 2 programs in the Indian.
Challenge: Implement the GCOS Climate Reference Tide Gauge Station Network 58% complete Goal: 170 stations reporting in real time and geocentrically located (presently 69) 170 Climate Reference Tide Gauge Stations Could Provide Tsunami Warning in Real Time
Blue “Climate” Stations collected data during the December 2005 tsunami
Integrating Climate and Tsunami Buoy Support Services Sites where Tsunami and Climate plans overlap -- potential for coordination Sites where Climate missions already deploy tsunami buoys routinely
Monthly Reports to the Department of Commerce:New Climate Observations Introduced • FY2004 Target: 275 new ARGO floats deployed; • FY2004 Actual: • 529 ARGO floats, • 792 total ocean observing platforms FY 2004 Cumulative observing platforms deployed • FY2005 Target: 1013 new platforms deployed; • FY2005 Actual to date: • 203 ARGO floats, • 230 total ocean observing platforms FY 2005
Observing System Status: 2004, Q4. Sea Surface Temperature Evaluate Effectiveness Ship observations not shown Requirement: All boxes blue 100 80 60 40 20 0 Drifting Buoys Moored Buoys Ships Total Goal: 100% Global Coverage Drifting Buoys + Moored Buoys + Weighted Ship Observations Percent of 5x5 Boxes with 25 Observations per Week
System Operations Click on System Buttons for links to Country Contributions and International Programs Coastal Moored Buoys Satellites, Sea Surface Temperature, Sea Surface Height, Surface Vector Wind, Ocean Color, and Sea Ice Ice Buoys Dedicated Ship Operations, Ocean Carbon and Hydrographic Surveys Surface Drifting Buoys Tropical Moored Buoys Volunteer Observing Ships, Ships of Opportunity Coastal Moored Buoys Data and Assimilation Subsystems Surface Drifting Buoys Argo Profiling Floats Product Delivery 1. Links to International Program Web Site(s) 2. Links to National Center(s) Web Sites www.jcommops.org/network_status Tide Gauge Stations Data and Assimilation Subsystems Ocean Reference Stations and Ocean Transport Monitoring Product Delivery Global Ocean Observing System for Climate and Marine Services
Standard Base Map • Equidistant Cylindrical Projection • 90N to 90S • Broken at 30 E • Evaluation Key: Blue-is-good to Red-is-bad • Measurement Key: Blue for low values, Red for high values • Depth Key: Blue for deep, Red for surface
$ K $23,578 $20,792 $15,319 $13,404 FY 2002 FY 2003 FY 2004 FY 2005
FY 2006 Budget Planning • Ocean Observations for Climate (+$3.5 million) • Incremental advancements across all networks • Sea level • Tide gauge stations --Real-time GCOS Reference Stations • Ocean carbon • pCO2 on ships and buoys • Dedicated ship time for Carbon/CLIVAR survey • Ocean Heat and Fresh Water • Dedicated ship time for Ocean Reference Stations • More Ship of Opportunity HRX lines • Surface Salinity on drifters. Ships? • Automated met stations on VOS? • Gliders? Moorings? • Ice Mass Balance Buoys? • Tropical Buoy Expansion (+$3.2 million) • Indian Ocean -- 50% of the array • Next Generation Technology development • Salinity on TAO • TAO/PIRATA Ocean Reference Stations • PIRATA extensions
Ocean Analysis and Expert TeamQuestions from last year’s Annual System Review • Should we undertake a program of ocean analysis? YES • What percent of the budget is reasonable? 20% of ‘04 increase? • Do you favor: • Seven Teams? • One Team? ONE TEAM • Phased, community-wide workshop approach?
Following the OCO Annual System Review C&GC and Climate Monitoring Working Groups Duck Key, April 2004 • An integrated observing system strategy must include observations and subsequent analysis components
Next Question: • Where is the boundary between the Observing System in the context of total climate services? • I.e., what should be funded in the Observing System Box and what should be funded by other Climate Programs? • Pilot projects will help answer this programmatic issue. • Pilot projects in 7 of the 8 products areas. • Partnership with NCEP to deliver GODAS Model Products.
Suite of Ocean Analysis Products • Sea level to identify changes resulting from climate variability. • Ocean carbon content every ten years and the air-sea exchange seasonally. • Sea surface temperature and surface currents to identify significant patterns of climate variability. • Sea surface pressure and air-sea exchanges of heat, momentum, and fresh water to identify changes in forcing functions driving ocean conditions and atmospheric conditions. • Ocean heat and fresh water content and transports to: • identify changes in the global water cycle • identify changes in thermohaline circulation and monitor for indications of possible abrupt climate change • identify where anomalies enter the ocean, how they move and are transformed, and where they re-emerge to interact with the atmosphere. • Sea ice thickness and concentrations.
GODAS Model Products1. EMC data files in WMO standard GRIB format2. CPC plots, data, and intercomparisons • Global X-Y Plots • OI SST • Temperature at 5 meter depth • Sea level height • Sea level pressure • Surface ocean current • Surface wind stress • Surface net heat flux • Surface net fresh water flux • Depth of 20 degree thermocline • Mixing layer depth • Heat storage in the upper 400 meters • Vertical Section Plots • Temperature at Equator • Zonal current at equator • Temperature and meridional current at 165E • Temperature and meridionla current at 140W • Temperature and meridional current at 110W • Temperature and meridional current at 30W • Hovmoeller Plots (Time-Longitude Plots averaged at 2S-2N) • OI SST • Sea level height • Sea level pressure • Zonal wind stress • Depth of 20 degree thermocline • Observation Data Distribution • Temperature • XBT • Argo • TAO/TRITON • PIRATA • Salinity • Argo • Altimetry sea level • Model and Observation Intercomparison • Temperature • XBT • Argo • TAO/TRITON • PIRATA • Salinity • Argo FY 2006 CTB Partnership: Proposals to enhance and evaluate the NOAA operational global ocean analysis system and products. LOIs to CTB due May 20.
Thank You photo courtesy of MeteoFrance