Download
1 / 32
330 likes | 427 Vues
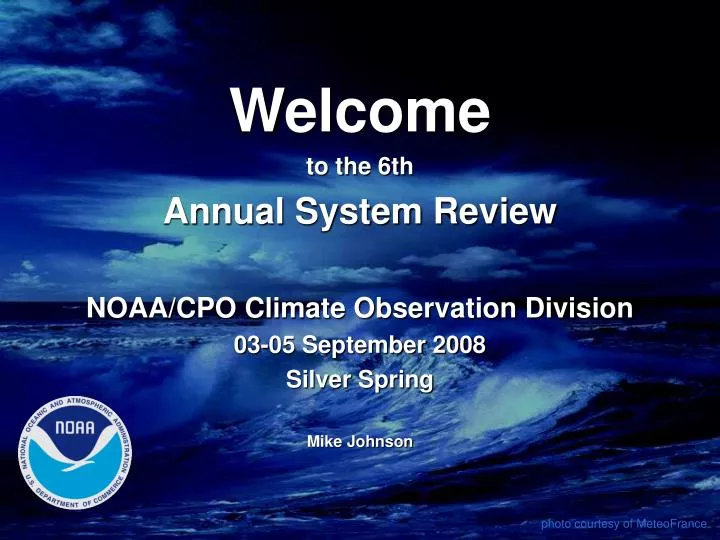
Welcome to the 6th Annual System Review NOAA/CPO Climate Observation Division 03-05 September 2008 Silver Spring Mike Johnson. photo courtesy of MeteoFrance. Welcome. Data providers Data users Presenters Poster Presenters Program Managers Session Chairs COSC All Climate Observers.

E N D
Welcome to the 6th Annual System Review NOAA/CPO Climate Observation Division 03-05 September 2008 Silver Spring Mike Johnson photo courtesy of MeteoFrance
Welcome • Data providers • Data users • Presenters • Poster Presenters • Program Managers • Session Chairs • COSC • All Climate Observers photo courtesy of MeteoFrance
Climate Observation Program Mission Build and sustain a global climate observing system that will respond to the long-term observational requirements of the operational forecast centers, international research programs, and major scientific assessments. 2008 Review: focus on the in situ Ocean component
2008 Annual Review Theme:Toward the Next Decade • Planning is now underway for OceanObs’09 (21-25 September 2009, Venice) • The OceanObs’09 symposium will celebrate a decade of progress and make a major contribution to chart the way forward for the coming decade. • Many of you played a significant role in OceanObs’99 and many will play a significant role in OceanObs’09 • Our 6th Annual System Review will be a springboard to help begin the year-long planning leading up to the OceanObs’09 symposium next September.
A Decade of Progress • A decade has passed since the OceanObs’99 symposium played a major role in consolidating the plans for a comprehensive ocean observing system. • Now, for the first time in history, the world’s oceans are being observed routinely and systematically. Status against initial targets: 60% 1999 2004 2008 photo courtesy of MeteoFrance
2008 15 countries contribute 95% 7723 in situ platforms globally 3860 platforms sponsored by NOAA 73 contributing counties 339 1999
Initial Objectives How well are we doing? What else? • Sea level to identify changes resulting from climate variability and change; • Ocean carbon content every ten years and the air-sea exchange seasonally; • Sea surface temperature and surface currents to identify significant patterns of climate variability; • Sea surface pressure and air-sea exchanges of heat, momentum, and fresh water to identity changes in forcing function driving ocean conditions and atmospheric conditions; • Ocean heat and fresh water content and transports to: (1) identify changes in the global water cycle; (2) identify changes in thermohaline circulation and monitor for indications of possible abrupt climate change; and (3) identify where anomalies enter the ocean, how they move and are transformed, and where they re-emerge to interact with the atmosphere; and • Sea ice extent, concentrations, and thickness to identify changes resulting from, and contributing to, climate variability and change.
Tools • In situ moored and drifting buoy arrays, profiling floats, tide gauge stations, bottom-mounted and ship-based systems. • Continuous satellite missions for sea surface temperature, sea surface height, surface vector wind, ocean color, and sea ice. • Data and assimilation subsystems, global-scale models. • System management and product delivery.
The 2008 Annual System ReviewToward the Next Decade Major Topics to guide Discussion: • Progress of the observing system over the past decade • Combined use of satellite, in situ, and modeling techniques to observe the global ocean • Scientific results, uncertainties, and present capabilities of the existing observing system • Issues; gaps in the system; additional capabilities that are needed to reduce errors, improve scientific understanding, document change, and enable climate forecasting
The 2008 Annual System ReviewToward the Next Decade Organizing Drivers/Deliverables: • Rising Sea Level and the Ocean’s Storage of Heat • Ocean Circulation and Global Transport of Heat and Fresh Water • Ocean Biogeochemistry • The Ocean’s Influence on Variability in Seasonal Temperatures, Precipitation, Sea Ice, and Extreme Events • User Requirements and Applications: • Operational Forecast Centers -- NCEP/EMC • International Research Programs -- WCRP • Major Scientific Assessments -- IPCC • Observing System Data Management -- OSMC
The 2008 Annual System Review Agenda Wednesday • Session 1: OceanObs’09 -- Setting the Stage • Keynote: Ed Harrison -- OOPC • Session 2: Ocean Circulation and Global Transport of Heat and Fresh Water • Chair: David Legler -- US CLIVAR • Session 3: Biogeochemistry • Chair: Maria Hood -- IOCCP • Reception and Poster Session
The 2008 Annual System Review Agenda Thursday • Session 4: The Ocean’s Influence on Variability in Seasonal Temperatures, Precipitation, Sea Ice, and Extreme Events • Chair: Ed Sarachick -- UW • Session 5: Rising Sea Level and the Ocean’s Storage of Heat • Chair: Kevin Trenberth NCAR • Group Dinner
The 2008 Annual System Review Agenda Friday • Session 6: User Requirements and Applications • Chair: Ming Ji -- NCEP/OPC • COSC Open Session • Program Planning and Budget • Climate Services: The Sustained Ocean Observing System as a Foundation Climate Service • Discussion • COSC Executive Session • Planning for in-depth project reviews
2008 Keynote AddressOceanObs’09 SymposiumOverviewEd HarrisonChair, OOPC
The Plan is in place • GCOS-92: • Initial GOOS • GEOSS Ocean Baseline • UNFCCC Priority • G8 Commitment Implement the ocean domain of GCOS-92: JCOMM is identified as the implementing agent for 21 specific actions. Partnership Tsunami IPY IOOS, Regional GOOS
Initial Global Ocean Observing System for Climate Status against the GCOS Implementation Plan and JCOMM targets Total in situ networks 60% February 2008 87% 100% 62% 81% 100% 43% 79% 24% 48% Milestones Drifters 2005 Argo 2007
Progress Toward Global Coverage (representative milestones) Goal 2001 2002 2000 2003 2004 2005 2006 2007 2008 Real-time Stations Initial GCOS Subset 170 112 102 Tide Gauges 85 79 67 67 69 51 56 1250 1250 1250 1294 1258 779 787 807 671 Number of buoys 975 Surface Drifting Buoys 131 97 103 Number of moorings 86 91 Tropical Moored Buoys 77 77 79 79 83 High resolution and frequently repeated lines occupied 51 41 41 41 39 Ships of Opportunity 27 26 26 24 23 3055 3000 3000 Number of floats 544 20 31 Argo Floats 2240 2557 1572 923 Number of observatories, flux, and ocean transport stations 87 43 42 41 47 37 15 35 Reference Stations 29 46 Ice buoys, drifting and Moored stations 73 21 19 19 20 20 Arctic System 18 24 21 21 37 Repeat Sections Committed, One inventory per 10 years 1 20 22 Ocean Carbon Network 0 0 15 17 5 9 882 340 Days at sea (NOAA contribution) Dedicated Ship Time 492 489 468 370 370 458 458 458 Essential Climate Variables Reported (NOAA contribution) 15 3 1 Analysis Products 8 0 1 1 4 5 6 Initial Ocean Observing System Milestones including international contributions Initial Targets 30 34 40 44 48 53 60 66 77 100 System % Complete Index 60 59 45 40 34 30 Total System 55 56 48 Goal 2001 2002 2000 2003 2004 2005 2006 2007 2008
Surface Drifting Buoys 1250 sustained array achieved 281 Moored Buoys reporting
Tropical Moored Buoys • TAO/TRITON sustained • PIRATA Extensions implemented • RAMA getting started
Argo Profiling Float Array 3000 floats achieved
Upper Ocean Thermal Line Sampling Well sampled lines: 18 Over sampled lines: 1 50% sampled lines: 3 Under sampled lines: 14 Lines not yet occupied: 10 41 of 51 UOT XBT lines now occupied.
Volunteer Observing Ships 910 VOS reporting at least 25 weather observations per month. 215 VOSClim ships registered
NOAA Contributions Future NSF OOI Deploying and maintaining 89 Ocean Reference Stations (43 now in service)
Measuring Ocean Carbon Sources and Sinks • 1. Inventory 10-year survey • 2. Ships of opportunity • 3. Moored buoy time series 38% complete
IPY -- legacy (sustained)Arctic Observing Network Sustained Arctic Observing Network International Design to be completed in 2008
Satellites: • sea surface temperature • sea surface height • surface vector wind • ocean color • sea ice
Data Assimilating Models http://www.cpc.ncep.noaa.gov/products/GODAS/
Where the Work gets done UAF WHOI JCOMM 73 Nations LDEO CSAR PMEL GFDL NODC LSA UW OCO ESRL NCEP SIO NCDC CLS CO-OPS UH FSU NDBC AOML BBSR 22 Centers of Expertise * 168 People UM • In Situ System Funding: $40.8 M • 54% External • 42% NOAA • 04% Private RGOOS * 34 Institutions
At the Turn of the Century … FY 2000: Strategic Plan • Build the system in the context of a comprehensive, multi-year climate services initiative. • Set a 2000-2010 timeline. • Define the objectives. • Define an “initial observing system” to accomplish the objectives. Identify annual milestones to complete the initial system over 10 years. • Emphasize that the initial system must be evolutionary. • State the obvious: a global observing system cannot be built with existing budgets. • Estimate the NOAA will implement about 50%. Work with national and international partners to achieve 100%.