Download
1 / 1
10 likes | 78 Vues
Additional Research Seafloor Habitat

E N D
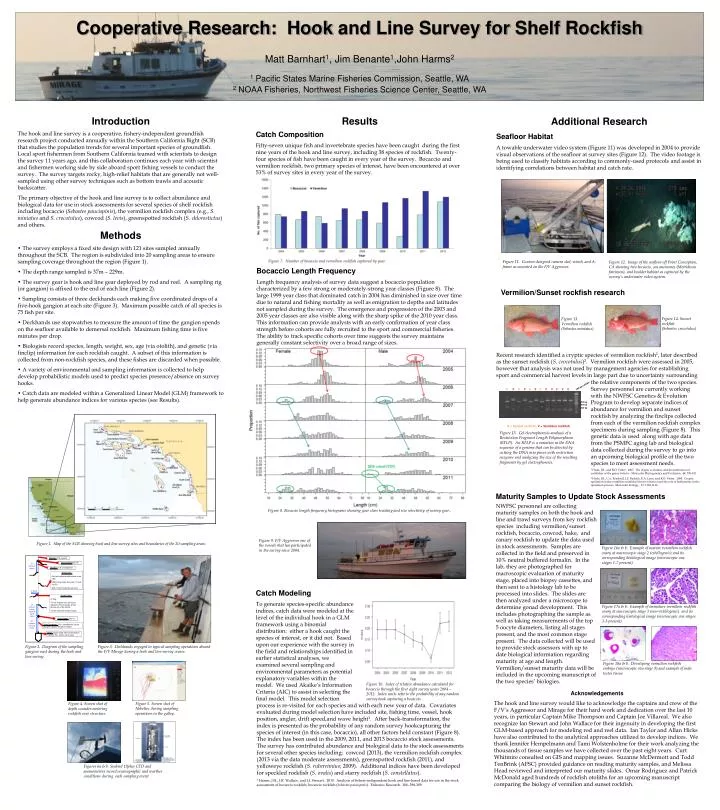
Additional Research Seafloor Habitat A towable underwater video system (Figure 11) was developed in 2004 to provide visual observations of the seafloor at survey sites (Figure 12). The video footage is being used to classify habitats according to commonly-used protocols and assist in identifying correlations between habitat and catch rate. Figure 11. Custom-designed camera sled, winch, and A-frame as mounted on the F/V Aggressor. Figure 12. Image of the seafloor off Point Conception, CA showing two bocaccio, sea anemones (Metridium farcimen), and boulder habitat as captured by the survey’s underwater video system. Bocaccio Length Frequency Length frequency analysis of survey data suggest a bocaccio population characterized by a few strong or moderately-strong year classes (Figure 8). The large 1999 year class that dominated catch in 2004 has diminished in size over time due to natural and fishing mortality as well as emigration to depths and latitudes not sampled during the survey. The emergence and progression of the 2003 and 2005 year classes are also visible along with the sharp spike of the 2010 year class. This information can provide analysts with an early confirmation of year class strength before cohorts are fully recruited to the sport and commercial fisheries. The ability to track specific cohorts over time suggests the survey maintains generally constant selectivity over a broad range of sizes. 100 bp Ladder S VSVSVSV V V V V 800 bp 600 bp 300 bp S = Sunset rockfish,V = Vermilion rockfish Figure 15. Gel electrophoresis analysis of a Restriction Fragment Length Polymorphism (RFLP). An RFLP is a variation in the DNA sequence of a genome that can be detected by cutting the DNA into pieces with restriction enzymes and analyzing the size of the resulting fragments by gel electrophoresis. Catch Modeling To generate species-specific abundance indices, catch data were modeled at the level of the individual hook in a GLM framework using a binomial distribution: either a hook caught the species of interest, or it did not. Based upon our experience with the survey in the field and relationships identified in earlier statistical analyses, we examined several sampling and environmental parameters as potential explanatory variables within the model. We used Akaike’s Information Criteria (AIC) to assist in selecting the final model. This model selection Figure 10. Index of relative abundance calculated for bocaccio through the first eight survey years 2004 – 2012. Index units refer to the probability of any random survey hook capturing a bocaccio. Cooperative Research: Hook and Line Survey for Shelf Rockfish Matt Barnhart1, Jim Benante1,John Harms2 1Pacific States Marine Fisheries Commission, Seattle, WA 2NOAA Fisheries, Northwest Fisheries Science Center, Seattle, WA Introduction The hook and line survey is a cooperative, fishery-independent groundfish research project conducted annually within the Southern California Bight (SCB) that studies the population trends for several important species of groundfish. Local sport fishermen from Southern California teamed with scientists to design the survey 11 years ago, and this collaboration continues each year with scientist and fishermen working side by side aboard sport fishing vessels to conduct the survey. The survey targets rocky, high-relief habitats that are generally not well-sampled using other survey techniques such as bottom trawls and acoustic backscatter. The primary objective of the hook and line survey is to collect abundance and biological data for use in stock assessments for several species of shelf rockfish including bocaccio (Sebastes paucispinis), the vermilion rockfish complex (e.g., S. miniatus and S. crocotulus), cowcod (S. levis), greenspotted rockfish (S. chlorostictus) and others. Results Catch Composition Fifty-seven unique fish and invertebrate species have been caught during the first nine years of the hook and line survey, including 38 species of rockfish. Twenty-four species of fish have been caught in every year of the survey. Bocaccio and vermilion rockfish, two primary species of interest, have been encountered at over 53% of survey sites in every year of the survey. Methods • The survey employs a fixed site design with 121 sites sampled annually throughout the SCB. The region is subdivided into 20 sampling areas to ensure sampling coverage throughout the region (Figure 1). • The depth range sampled is 37m – 229m. • The survey gear is hook and line gear deployed by rod and reel. A sampling rig (or gangion) is affixed to the end of each line (Figure 2). • Sampling consists of three deckhands each making five coordinated drops of a five-hook gangion at each site (Figure 3). Maximum possible catch of all species is 75 fish per site. • Deckhands use stopwatches to measure the amount of time the gangion spends on the seafloor available to demersal rockfish. Maximum fishing time is five minutes per drop. • Biologists record species, length, weight, sex, age (via otolith), and genetic (via finclip) information for each rockfish caught. A subset of this information is collected from non-rockfish species, and these fishes are discarded when possible. • A variety of environmental and sampling information is collected to help develop probabilistic models used to predict species presence/absence on survey hooks. • Catch data are modeled within a Generalized Linear Model (GLM) framework to help generate abundance indices for various species (see Results). Vermilion/Sunset rockfish research Figure 14. Sunset rockfish (Sebastes crocotulus) Figure 13. Vermilion rockfish (Sebastes miniatus) Recent research identified a cryptic species of vermilion rockfish1, later described as the sunset rockfish (S. crocotulus)2. Vermilion rockfish were assessed in 2005, however that analysis was not used by management agencies for establishing sport and commercial harvest levels in large part due to uncertainty surrounding the relative components of the two species. Survey personnel are currently working with the NWFSC Genetics & Evolution Program to develop separate indices of abundance for vermilion and sunset rockfish by analyzing the finclips collected from each of the vermilion rockfish complex specimens during sampling (Figure 8). This genetic data is used along with age data from the PSMFC aging lab and biological data collected during the survey to go into an upcoming biological profile of the two species to meet assessment needs. 1 Hyde, J.R., and R.D. Vetter. 2007. The origin, evolution, and diversification of rockfishes of the genus Sebastes. Molecular Phylogenetics and Evolution. 44: 790-811. 2 Hyde, J.R., C.A. Kimbrell, J.E. Budrick, E.A. Lynn, and R.D. Vetter. 2008. Cryptic speciation in the vermilion rockfish (Sebastes miniatus) and the role of bathymetry in the speciation process. Molecular Ecology. 17: 1122-1136. Maturity Samples to Update Stock Assessments NWFSC personnel are collecting maturity samples on both the hook and line and trawl surveys from key rockfish species including vermilion/sunset rockfish, bocaccio, cowcod, hake, and canary rockfish to update the data used in stock assessments. Samples are collected in the field and preserved in 10% neutral buffered formalin. In the lab, they are photographed for macroscopic evaluation of maturity stage, placed into biopsy cassettes, and then sent to a histology lab to be processed into slides. The slides are then analyzed under a microscope to determine gonad development. This includes photographing the sample as well as taking measurements of the top 5 oocyte diameters, listing all stages present, and the most common stage present. The data collected will be used to provide stock assessors with up to date biological information regarding maturity at age and length. Vermilion/sunset maturity data will be included in the upcoming manuscript of the two species’ biologies. Figure 8. Bocaccio length frequency histograms showing year class tracking and size selectivity of survey gear.. Figure 9. F/V Aggressor one of the vessels that has participated in the survey since 2004. Figure 1. Map of the SCB showing hook and line survey sites and boundaries of the 20 sampling areas. Figure 16a & b. Example of mature vermilion rockfish ovary at macroscopic stage 2 (vitellogenic) and its corresponding histological image (microscopic ova stages 1-7 present) Figure 17a & b. Example of immature vermilion rockfish ovary at macroscopic stage 1 (non-vitellogenic) and its corresponding histological image (microscopic ova stages 1-3 present) Figure 2. Diagram of the sampling gangion used during the hook and line survey. Figure 3. Deckhands engaged in typical sampling operations aboard the F/V Mirage during a hook and line survey cruise. Figure 18a & b. Developing vermilion rockfish embryo (microscopic ova stage 9) and example of male testes tissue Acknowledgements The hook and line survey would like to acknowledge the captains and crew of the F/V’s Aggressor and Mirage for their hard work and dedication over the last 10 years, in particular Captain Mike Thompson and Captain Joe Villareal. We also recognize Ian Stewart and John Wallace for their ingenuity in developing the first GLM-based approach for modeling rod and reel data. Ian Taylor and Allan Hicks have also contributed to the analytical approaches utilized to develop indices. We thank Jennifer Hempelmann and Tami Wolstenholme for their work analyzing the thousands of tissue samples we have collected over the past eight years. Curt Whitmire consulted on GIS and mapping issues. Suzanne McDermott and Todd TenBrink (AFSC) provided guidance on reading maturity samples, and Melissa Head reviewed and interpreted our maturity slides. Omar Rodriguez and Patrick McDonald aged hundreds of rockfish otoliths for an upcoming manuscript comparing the biology of vermilion and sunset rockfish. Figure 5. Screen shot of Nobeltec during sampling operations in the galley. Figure 4. Screen shot of depth sounder metering rockfish over structure process is re-visited for each species and with each new year of data. Covariates evaluated during model selection have included site, fishing time, vessel, hook position, angler, drift speed,and wave height1. After back-transformation, the index is presented as the probability of any random survey hookcapturing the species of interest (in this case, bocaccio), all other factors held constant (Figure 8). The index has been used in the 2009, 2011, and 2013 bocaccio stock assessments. The survey has contributed abundance and biological data to the stock assessments for several other species including: cowcod (2013), the vermilion rockfish complex (2013 via the data moderate assessments), greenspotted rockfish (2011), and yelloweye rockfish (S. ruberrimius; 2009). Additional indices have been developed for speckled rockfish (S. ovalis) and starry rockfish (S. constellatus). 1 Harms, J.H., J.R. Wallace, and I.J. Stewart. 2010. Analysis of fishery-independent hook and line-based data for use in the stock assessment of bocaccio rockfish, bocaccio rockfish (Sebastes paucispinis). Fisheries Research. 106, 298-309. Figures 6a & b. Seabird 19plus CTD and anemometers record oceanographic and weather conditions during each sampling event.