
SlideServe
Menu
Préférences
© SlideServe · v2026

Solve & Graph

onawa avatar
16 diapositives · 328 Views · Aug 14, 2014

Solve & Graph. Solve & Graph. Solve & Graph. Graphing Linear Inequalities. Graph 2x-3y<9. Graphing linear inequalities. Graph 3x+4y > -8. Graphing Linear inequalities. Graph -2x-5y>15. Scatterplots & Line of Best Fit. Create a scatterplot & find the line of best fit.
Solve &amp; Graph - slide 1
01 / 16Solve &amp; Graph
1 / 17

Télécharger la présentation

Solve &amp; Graph
Une image / un lien ci-dessous est fourni (tel quel) pour télécharger la présentation

Politique de téléchargement : le contenu du site vous est fourni TEL QUEL pour votre information et votre usage personnel ; il ne peut être vendu, concédé sous licence ni partagé sur d’autres sites sans l’accord de son auteur.Le contenu vous est fourni TEL QUEL, pour votre information et votre usage personnel uniquement. Téléchargez la présentation en cliquant sur ce lien. Lors du téléchargement, si vous ne parvenez pas à télécharger une présentation, l’éditeur a peut-être supprimé le fichier de son serveur.Pendant le téléchargement, si vous ne parvenez pas à obtenir une présentation, le fichier a peut-être été supprimé par l’éditeur.

F I N

Plus de contenu associé

Transcription de la présentation
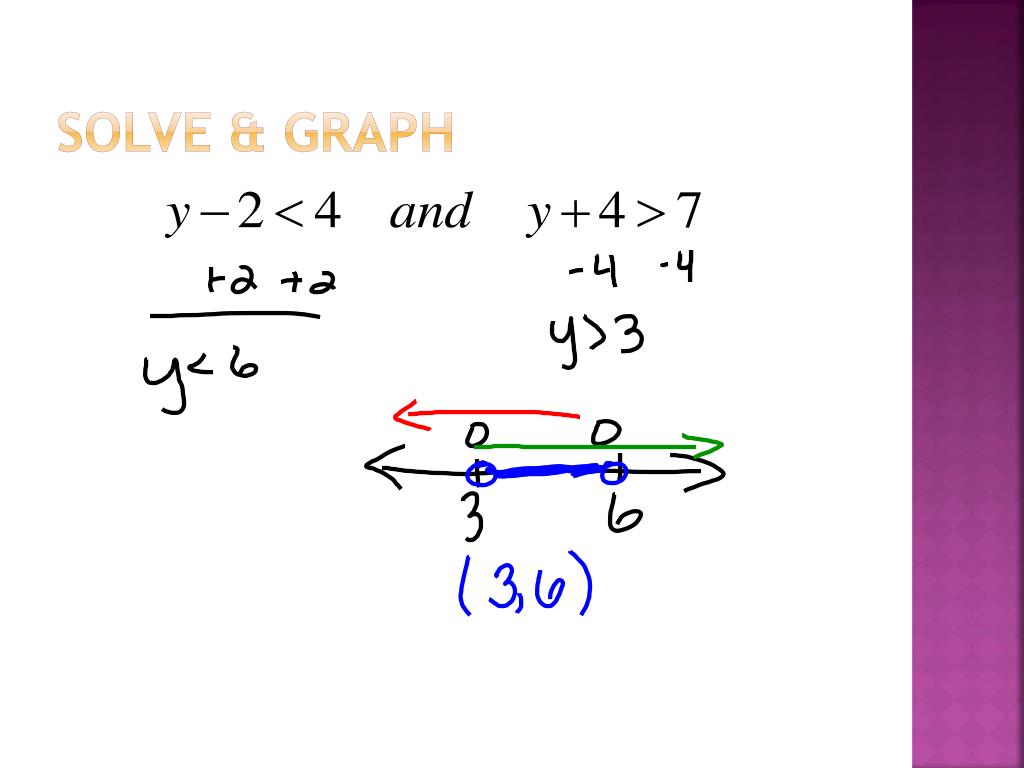
  1. Solve & Graph

  2. Solve & Graph

  3. Solve & Graph

  4. Graphing Linear Inequalities • Graph 2x-3y<9

  5. Graphing linear inequalities • Graph 3x+4y > -8

  6. Graphing Linear inequalities • Graph -2x-5y>15

  7. Scatterplots & Line of Best Fit

  8. Create a scatterplot & find the line of best fit.

  9. Using the graphing calculator:

  10. Graphing steps continued

  11. Correlation • Used to describe the relationship between the independent variable (x) and the dependent variable (y). • It’s on a scale from -1 to 1 with the endpoints representing a perfect linear relationship.

  12. Types of Correlation

  13. This refers back to the problem about weight classes

  14. Let’s try another one! Use it to predict the sodium for 40 g of fat.

  15. Practice Problem • Find equation of the least-squares line. • Find and explain the correlation coefficient, r. • Predict the number of CD’s purchased by a person who is 27 years old. • Find the age of a person who purchased 15 CD’s in the previous year.