Download
1 / 24
250 likes | 387 Vues
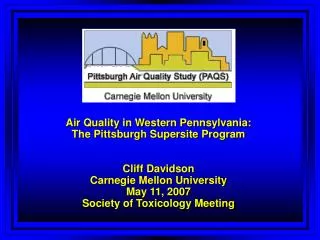
Air Quality in Western Pennsylvania: The Pittsburgh Supersite Program Cliff Davidson Carnegie Mellon University May 11, 2007 Society of Toxicology Meeting. Acknowledgments Funding: EPA Supersites Program and DOE-NETL Faculty: Spyros Pandis, Allen Robinson, and Cliff Davidson

E N D
Air Quality in Western Pennsylvania: The Pittsburgh Supersite ProgramCliff DavidsonCarnegie Mellon UniversityMay 11, 2007Society of Toxicology Meeting
Acknowledgments Funding: EPA Supersites Program and DOE-NETL Faculty: Spyros Pandis, Allen Robinson, and Cliff Davidson Research Scientists: Andrey Khlystov and Beth Wittig Graduate StudentsUndergraduates CEEChem EKizzy Dilts Natalie Anderson Juan Cabada Emma Goodson Satoshi Takahama Tim Raymond Naima Hall Wei Tang Charlie Stanier Emily Laufer CEE/EPPMech ELenny Lucas Sarah Rees R. Subramaniam Laura Sperduto Eric Lipsky
1. Background of the Pittsburgh Air Quality Study 2. Instrumentation 3. Examples of Findings 4. Conclusions
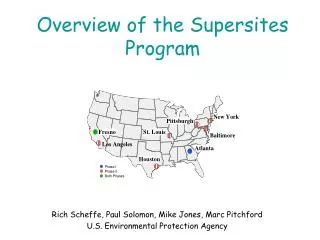
The Pittsburgh Air Quality Study (PAQS) EPA Supersite Locations New York Pittsburgh Baltimore St Louis Fresno Los Angeles Atlanta Houston
Objectives of the Supersite Program 1. Characterize detailed physics and chemistry of airborne particles 2. Develop and test new instrumentation for measuring particles 3. Identify sources of the particles 4. Develop a database that can be used to determine which characteristics of particles are responsible for health effects
Spherical Fe-rich Particle 7500X 1 µm Carbon Chain Agglomerate
Examples of Findings • 1. Origin of PM2.5 in Pittsburgh area • local vs. long-range transport • 2. Improved instrumentation • virtually all chemical data are from time-integrated samplers • what can we learn from real-time samplers? • 3. Chemical Composition and PM Control Strategies • sulfate accounts for >1/3 of PM2.5 • if we reduce sulfur emissions, how much does PM2.5 reduce?
Satellite Sites Lawrenceville CMU site Hazelwood Florence Greensburg
July 25, 2001 Mixing height: 7 am 822 m 7 pm 1123 m
July 18, 2001 Mixing height: 7 am 1370 m 7 pm 811 m
Examples of Findings • 1. Origin of PM2.5 in Pittsburgh area • local vs. long-range transport • 2. Improved instrumentation • virtually all chemical data are from time-integrated samplers • what can we learn from real-time samplers? • 3. Chemical Composition and PM Control Strategies • sulfate accounts for >1/3 of PM2.5 • if we reduce sulfur emissions, how much does PM2.5 reduce?
Examples of Findings • 1. Origin of PM2.5 in Pittsburgh area • local vs. long-range transport • 2. Improved instrumentation • virtually all chemical data are from time-integrated samplers • what can we learn from real-time samplers? • 3. Chemical Composition and PM Control Strategies • sulfate accounts for >1/3 of PM2.5 • if we reduce sulfur emissions, how much does PM2.5 reduce?
How can reducing sulfur emissions cause an increase in PM2.5? NH4+ Decrease SO42- SO42- NH4+ Ammonium sulfate NH4NO3 Ammonium nitrate NO3 (as HNO3) 2 NH4NO3 (NH4)2SO4
Conclusions • PM2.5 is mainly regional -- most is not generated locally. Source regions are identifiable. • Continuous monitors show some chemical species have large diurnal variations: nitrate varies greatly, sulfate varies very little. • Sum of the chemical constituents may be different than the total mass using the FRM, partially due to water uptake. • 4. Chemistry involving airborne particles can be complex -- reducing emissions of sulfur does not guarantee reduction in PM2.5.