Overview of the Supersites Program
550 likes | 760 Vues
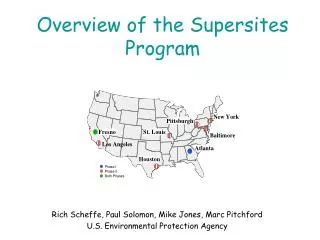
Overview of the Supersites Program. Rich Scheffe, Paul Solomon, Mike Jones, Marc Pitchford U.S. Environmental Protection Agency. Results for Pittsburgh and Philadelphia (~250 miles apart) for July 2, 2001. Pittsburgh. Clean, cool air mass from Canada. Philadelphia.

Overview of the Supersites Program
E N D
Presentation Transcript
Overview of the Supersites Program Rich Scheffe, Paul Solomon, Mike Jones, Marc Pitchford U.S. Environmental Protection Agency
Results for Pittsburgh and Philadelphia (~250 miles apart) for July 2, 2001 Pittsburgh Clean, cool air mass from Canada Philadelphia
Effect of transport on PAH size distribution (Eiguren et al., Aerosol Science and Technology, 2002) Fraction by mass Fraction by mass
Enhancing dimensionality to routine programs by slicing, compositing, continuously 24-hr mass
Theme: A National Tool for Integration across disciplines and organizations Regulatory organizations and Tribes Supersites Atmospheric Sciences Health effects and exposure sciences
Acknowledge: Phase II Supersite PI’s/Teams (and apologies for not getting it…or unequal distribution of emphasis…..meaningless) Fresno: John Watson, DRI, Fresno, CA Supersite Phase II Houston: David Allen, Un. TX @ Austin, "Gulf Coast Aerosol Research and Characterization Program." St Louis: Jay Turner, Washington University "St. Louis - Midwest Supersite" Los Angeles: John Froines, University California Consortium, "Southern California Particulate Matter Supersite" Baltimore: John Ondov, Un. MD, "Baltimore Supersite: Highly Time and Size Resolved Concentrations of Urban PM2.5 and its constituents for Resolution of Sources and Immune Responses." Pittsburgh: Spyros Pandis, Carnegie Mellon, "The Pittsburgh PM Supersite: A Multi-disciplinary Consortium for Atmospheric Aerosols Research" New York: Ken Demerjian, ASRC, NY-SUNY, "PM2.5 Technology Assessment and Characterization Study in New York."
Topics • History/Program basics • Principal Objectives • Tech transfer/enhancement role in national networks • Health/exposure • SIPS/characterization • Methods development/testing • Limited individual reports • Future skip
Supersites Program • Hypothesis Driven • Regional Projects • Single (+) central/comprehensive Site (s) • Regional Study • Ambient Monitoring • Leveraging of Resources (Other field campaigns, Health Effects related studies, Chemical Speciation and FRM Networks) • Cooperative Agreements Between EPA and Universities skip
Supersites After, July 1998 workshop, SS evolved into multi-objective program to link more directly with health studies and explore measurement technologies • Objectives • Particulate matter characterizationto understand processes and source-receptor relationships and to support SIPs • Health effects and exposureto support PM source-receptor-exposure-effects relationships • Methods testingto enable a smooth transition of advanced methods to routine networks
January 2000: Cooperative Agreements Awarded August January July 2001: 2000: 2002: Eastern December 2004: Houston Eastern Intensive I Phase II Ends Intensive Intensive II January 2005: April 2002: April 1999: August 1999: Phase III Ends Phase III Begins Fresno Atlanta Begins Intensive Phase III Phase I Integrated Data Analysis Phase II Supersites: Timeline
8 Enhanced Airsheds SS • ~50 Trends • (Mass & Components) • ~50 Sites • (Coordinated With SS) • 850 Required Routine Speciation • ~1050 Frm • (Compare to • NAAQS) • ~200 Sites (Sips) • ~100 Improve • ~ 100 • Continuous Mass Sampling SS: Role in PM2.5 Monitoring Program
PM2.5 Monitoring Objectives skip Primary Purpose(s) Secondary Purpose (s)
PM2.5 FRM map skip
Enhancing dimensionality to routine programs by slicing, compositing, continuously 24-hr mass skip
Methods development/evaluation examples • Semi-continuous speciation (N, S, C) samplers • Future continuous PMcoarse method • Particle size properties • Semi-continuous metals • Single particle mass spectrometry (SPMS)
NY:Semi-continuous PM2.5 Sulfate ConcentrationMeasurements by 4 Distinct Instruments Queens College, NY 10 min avg. data
NY: Correlation of Semi-continuous PM2.5 Sulfate Concentrations and 24-hour Filter Data Slopes: 0.76 - 0.85 Intercepts: -0.08 - 0.56 R2: 0.89-0.98
NY: A Particle Production Event Event # 3 – Comparison of Particle Production Rates: Average Sulfate Particle Production Rates: PILS = 0.873 mg/m3h; AMS = 0.844 mg/m3h; R&P 8400S = 0.464 mg/m3h
200 Peak 1-Hr O3 1-hr O3 NAAQS Peak 1-Hr NOY 180 Peak 1-Hr SO2 160 Peak 1-Hr CO/25 O3, SO2, CO, NOy (ppb) 140 120 60 100 55 80 50 45 60 40 40 35 20 30 0 25 20 15 PM2.5 Mass-TEOM 10 Sulfate 5 Carbonaceous Material 0 Carbonaceous Material (g m-3) 8/3/99 8/7/99 8/8/99 8/6/99 8/4/99 8/5/99 8/9/99 PM2.5 Mass, Sulfate, 8/21/99 8/11/99 8/12/99 8/16/99 8/17/99 8/18/99 8/19/99 8/20/99 8/23/99 8/25/99 8/27/99 8/29/99 8/10/99 8/13/99 8/15/99 8/22/99 8/26/99 8/28/99 8/24/99 8/14/99 8/30/99 8/31/99 Figure 5 Atlanta: Particle and gas phase measurements
Atlanta: Methods Intercomparisons Figure 4
LA: continuous coarse mass monitor(Misra et al., JAWMA, 51:1309-1317, 2001
Baltimore SEAS: Peak Concentrations are Typically 6x Greater than 24-hr Avg. Conc.; and 12x the “Background. Peak Conc = 12 ng/m3 Background Conc = 1±1 ng/m3 Daily Avg Conc = 2.2 ng/m3
SS Role in SIPs/General characterization • Globally • AQSM evaluation • S-R relationships • Enhanced carbon…specific organic compounds • Particle formation processes (from nucleation events) • Specifics • Quantifying local sulfate production • AQ Impact of diesel retrofits on bus fleets (CNG, CRT) /source characterizations • Delineating secondary/primary OC ratios • Delineating anthropogenic/biogenic OC ratios • Particle formation processes skip
EPA Designates Areas (2004-5) States Recommend Areas For Designation (2003-4) States Submit Implementation Plans & Control Strategies Date to Attain Standards Air Quality Model Applications EPA Finalizes PM-2.5 Transport Rule(2006) EPA Proposes PM-2.5 Transport Rule (2005) EPA Proposes Implem. Rule (2003) EPA Finalizes Implem. Rule (2004) 2005-06 2007-08 2009-15 2003-04 2004-05 SS Role in SIPs?….(AQSM evaluation, C)
Example Policy Relevant Questions • Seasonality of NOx limitations for nitrate formation (i.e., are winter NOx controls beneficial?) • Specific organic compound composition of aerosols to target “urban excess” sources • How much N replacement for S occurs… • Do VOC reductions increase, reduce, not affect PM nitrate levels? • Does a mass reduction focused startegy miss reducing key constituents (e.g., ultrafines, bound organics, soluble metals)?
Coverage of Relational Database Coordinated Effort During Intensives New York Pittsburgh Fresno St. Louis Baltimore Los Angeles Atlanta Houston Eastern Supersites Program (coordinated all field campaigns in Summer, 2001; major data base for diagnostic AQSM..CMAQ) evaluation)
Missed the really elevated events in the NE corridor July 16-22, 2000 Avg PM2.5 Aug 6-12, 2000 Avg PM2.5
St. Louis - Midwest Supersite 1 2 3 air mass back trajectories (NOAA/HYSPLIT) 1 2 3 Weather Systems St. Louis Supersite PM2.5 Sulfate & Air Mass Back Trajectories
Results for Pittsburgh and Philadelphia (~250 miles apart) for July 2, 2001 Pittsburgh skip Clean, cool air mass from Canada Philadelphia
Hygroscopicity of New Particles May 11, 2002 Experimentally Measured Growth Factor for 50/50 Mixtures of Organic Acids and (NH4)2SO4* Theory (NH4)HSO4 Theory H2SO4 Measured Growth Factors During Nucleation *Cruz and Pandis. Environ. Sci. Technol. 2000, 34, 4313-4319.
Measured Water Predicted Water Pittsburgh: Predicted v. Measured Water
Pittsburgh: Mass Balance Closure – July 2001 Water Crustal NO3 SO4 NH4 EC 60 OC*1.8 FRM 50 40 PM2.5 (mg m-3) 30 20 10 0 1 4 7 10 13 16 19 22 25 28 31 Date (July 2001) Good mass balance was achieved for the winter months
LA: 24-h Average PM10 Mass and Chemical Composition in Downey (Source Site) 14 Metals OC MMD ~ 0.35 um EC 12 (NH4)2OS4 NH4NO3 10 g/m3) m 8 Concentration ( 6 4 2 0 < 0.1 0.1 - 0.35 0.35 - 1.0 1 - 2.5 2.5 - 10 Particle Size Range, microns Singh et al Atmospheric Environment, 36(10): 1675-168, 2002
NY: Diurnal variation of H2SO4 production (OH+SO2) 10 min avg. data • H2SO4 production from OH + SO2 is about 5.1 μg/m3/day.
Baltimore Supersite Data for Se Show Coal Boiler Plumes (each figure shows approx. 4 days of 30 min measurements) Wind Direction June 6 June 7 June 8 June 9 June 10 6:00 PM skip 12:00 PM 12:00 PM 12:00 PM 12:00 PM 12:00 PM 150o to 220o – 12:30 to 6:00 PM 160o to 220o 1:00 to 5:00 PM 150o to 220o 2:00 to 6:00 PM 175o to 200o Se, ng/m3 • Plant location: 150o to 220o
160o coal-fired power plants Se 190o 190o 160o skip
HSO4- C-H R-ONO2 CO2 Stage 2, 1-2 mm R-ONO2 NH4+ C=O H2O Stage 3, 0.5-1 mm H2O Stage 4, 0.26-0.5 mm Stage 5, 0.12-0.26 mm Stage 6, 0.075-0.12 mm Stage 7, 0.05-0.075 mm Stage 8, 0.00-0.05 mm Houston: IR spectra by size distribution Org-NO3 size dist. 1µ .5µ Figure 6. Set of infrared spectra for all seven stages at HRM3 site for August 6, 2000.
Pittsburg: Ozone as indicator of SOA Production Ozone OC/EC Ratio O3 (ppb) OC/EC Ratio (front quartz)
OC (mg/m3) July August Pittsburgh: Daily Averaged OC Composition (July 2001) Undenuded Sampler (4-6 hrs samples) SECONDARY PRIMARY
Surprises from the Houston Supersite: 14C/13C Ratios suggest high percentages of geologically modern carbon at some sites • Up to 75% geologically modern carbon at downwind receptor sites • Possible sources are cooking, fires and biogenic secondary organic aerosol • Strong negative correlation between EC/TC and percentage modern carbon is evidence of biogenic secondary organic aerosol (BSOA) • BSOA possibly due ozone sesquiterpene reactions EC= elemental carbon TC= total carbon
Support to health effects and exposure studies • Direct collaboration in most locations. e.g.: • LA (also a PM health center) • Fresno (several ARB studies) • St. Louis (Harvard PM helath center) • Houston (Mickey Leland center) skip
Potential Health exposure/effects parameters from 98 workshop • PM mass • PM Particle size/surface area • Ultrafine PM • Metals • Acids • Organic compounds • Biogenic Particles • Sulfate and Nitrate salts • Peroxides • Soot • Cofactors skip
Overlap between health effects/exposure and atmospheric sciences/SIPs Air Quality Characterization
LA: Effect of transport on PAH size distribution (Eiguren et al., Aerosol Science and Technology, 2002) Fraction by mass skip Fraction by mass