Download

1 / 31
310 likes | 426 Vues
Explore the spatial distribution and disparities of colon cancer cases in Pennsylvania, identifying clusters and associations with socioeconomic factors for targeted interventions.

E N D
Mapping and Cancer Disparities Robin Taylor Wilson, PhD Assistant Professor Epidemiology Division Department of Public Health Sciences Penn State College of Medicine
Overview • Colon Cancer in Pennsylvania • Exploratory Spatial Data Analysis (ESDA) Software Development
Why use spatial data analysis? • Help prioritize cancer control and identify areas of success • e.g. left- and right-sided colon cancer screening • Help to understand access to screening and treatment in relation to stage at diagnosis • Classify environmental exposures not readily assessed by questionnaire or biomarkers • e.g. organophosphate pesticides • e.g. UVB index • Provide etiologic clues to disease • e.g. neighborhood context and physical activity • May prevent a major cancer cluster investigation
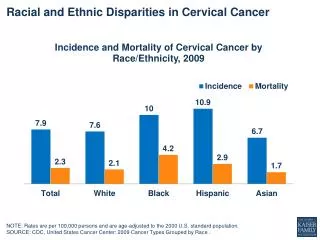
Spatial Analysis of Left- and Right-Sided Colon Cancer in Pennsylvania • Rationale: • The incidence of colon cancer in Pennsylvania is higher than the US all-races rate • Understanding left-sided spatial clustering may help focus cancer screening efforts in the state • Purpose: • Determine whether geographic clustering of colon cancer incidence occurs and whether cluster patterns differ by stage and site (left- versus right-sided) • Identify county-level characteristics associated with incidence
Methods: Colon Cancer in PA • Cases diagnosed between 1994-2002 were identified through the Pennsylvania Cancer Registry • Principal components analysis was used to create a county-level SES index based on 7 variables from the 2000 Census • County-level colon cancer screening and obesity prevalence were derived from the Behavioral Risk Factor Surveillance System • SaTScan was used to determine geographic clustering by county, adjusted for confounding variables • Poisson regression estimated incidence rate ratios (IRR) and 95% confidence intervals (CI) according to the county-distribution of age, sex, race, SES index, obesity, screening, and rural residence as defined by the Beale rural-urban continuum
Components of SES Index: Principal Component 1: 72% of variance
Right-sided Left-sided Gender Race Age Gender Race Age SES Gender Race Age Screening Gender Race Age Obesity SatScan: Spatial Cluster Results
Gender, Race, Age, SES Gender, Race, Age, Screening
Summary: Colon Cancer in PA • Lower SES was associated with higher left-sided colon cancer incidence (IRR=1.11, 95% CI: 1.03-1.19, p-trend=0.003), adjusting for age, sex, race, screening and obesity. • Clustering of late stage cancer persisted in two metro regions, including a three-county area in the north east (Beale=2) and two southeastern counties (Beale=1). • Adjustment for SES revealed a cluster of late stage cancer incidence in rural non-metro counties in the western portion of the state.
Conclusion: Colon Cancer in PA • Geographic clustering of left-sided and late stage colon cancer occurs. • The association between left-sided colon cancer and low SES requires replication.
Exploratory Spatial Data Analysis • Incidence Mapping • SatScan • O/E • Local Moran’s I • Star Plot overlay • Parallel Coordinate Plots
ESDA Example: Prostate Cancer Health Disparities • Multiple State Partners • New York • New Jersey • Iowa • South Carolina • Kentucky • Georgia • Pennsylvania • County-level and Census-Tract analyses
Acknowledgements • Penn State Department of Public Health Sciences • Eugene Lengerich • Erik Lehman • Yihai Liu • Penn State Department of Geography • Frank Hardisty • Mark Gahegan • Dan Addyson • State Partners • Gene Weinberg, Pennsylvania Department of Health • Tim Aldrich and Shannon Shropshire, East Tennessee State University • Jay Christian, University of Kentucky • Michele West and Gerard Rushton, University of Iowa • Frank Boscoe, School of Public Health, SUNY • Colleen McLaughlin, NY State Department of Health • Stanley Weiss, University of Medicine and Dentistry of New Jersey
Panel 1 2 3 4 Adjustedfor Gender Race Age Gender Race Age SES Gender Race Age Screening Gender Race Age Obesity SatScan: High and Low Clustering Right Sided Left Sided
Correlation between Model Covariates: SES Index, Screening prevalence and Obesity
Right Colon Left Colon Anatomy of colon and rectum
Obesity Gender, Race, Age