115
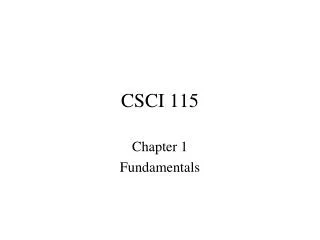
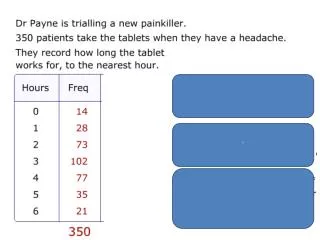
`. 14. 42. 115. 217. 294. 3 29. 350. Cumulative Frequency. How to draw a cumulative frequency graph. Draw a cumulative frequency diagram for this data. Create a third CUMULATIVE FREQUENCY column like this. You don’t have to show working. You don’t have to show working.

115
E N D
Presentation Transcript
14 42 115 217 294 329 350
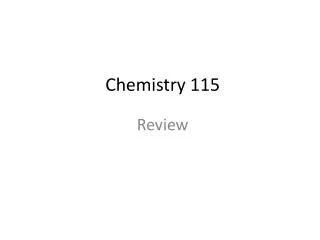
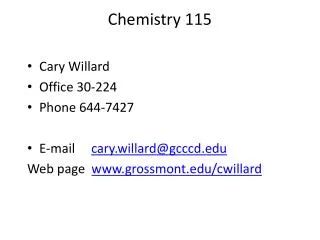
Cumulative Frequency How to draw a cumulative frequency graph
Plot the second number in the data column against the number in the cumulative frequency column Plot these numbers
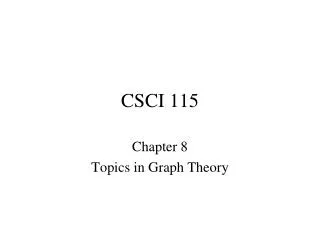
You can use this to find the middle half ¾ (18) ½ (12) Upper Q (53) ¼ (6) Median (42) Lower Q (30)
The Lower Quartile is 30 Median is 42 The Upper Quartile is 53 This means that the middle half is between 30 and 53. Called the inter-quartile range.53 – 30 = 23
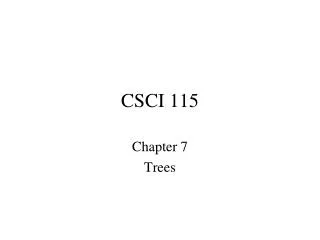
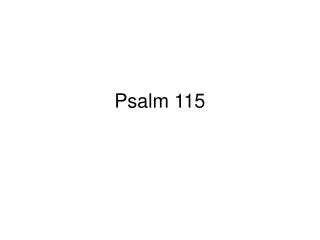
0 x < 20 2 < 20 x < 30 7 < 30 x < 35 18 < 35 x < 40 17 < 40 x < 50 < 5 50 x < 70 < 1 Teach GCSE Maths Rainfall (mm) Grouped Data and the Mean
Since the quantity is time, a t has been used instead of x. The t written between 0 and 20 means that the time is between 0 and 20 hours! 0t<20 < < < < e.g.1 This table gives the time taken for 30 components to fail. BUT, the extra line . . . means tcan also equal0. The numbers 20, 40 and 60, at the top of the classes, are called the “upper class boundaries” Decide with your partner if t can equal 20 in the 1st class. Tip: Tilt your head to the right and you can see the extra line making an equals sign. Ans: No. Measurements oft=20are in the2ndclass.
< < < Decide with your partner which number you would use to represent the 1st class ( 0 t < 20 ). < Suppose we want to find the mean time that a component lasts. To calculate an estimate of the mean, we need to choose one number in each class that represents the class. Tell your partner why, using the table, we cannot find the exact value of the mean. Ans: We don’t know the exact value of each time. For example, in the 1st class there are 5 failures. They could all have been in the 1st hour, or be equally spaced, or be 13·5, 16·2, 17, 18·7, 19·9 . . .or any times between0and20. Ans: t = 10. It is the mid-point of the class, the average of 0 and 20. To represent a class, we use the mid-point of the class.
< < < 1 1 1 (0 + 20) = 10 (20 + 40) = 30 (40 + 60) = 50 2 2 2 We will need an extra column for the mid-points ( which can also be called t ). In this question, the mid-points are easy to spot but we need to remember that a mid-point is the average of the numbers at each end of the class ( the boundary values ).
10 50 240 30 50 850 This column now gives t. < < < sum of t × f = sum of f 1140 30 t 30 1140 Now we can calculate an estimate of the mean time. mean time = total time ÷ number of components = = 38 hours Check: 38 is between 0 and 60.
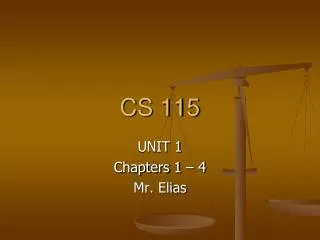
Length (cm) l Frequency f 10 l < 30 3 < < 30 l < 40 4 40 l < 50 9 < 50 l < 60 < 6 < 60 l < 90 3 Exercise 1. The table shows the lengths of 25 pieces of wood. (a) Calculate an estimate of the mean length. (b) Which is the modal class?
20 60 < < 35 140 45 405 < < 55 330 < 75 225 sum of l × f = sum of f 1160 = 25 (b) the modal class is 40 l < 50 < l × f Solution: Mid-value 1160 (a) mean length = total length ÷ number of pieces Check: 46·4 is between 10 and 90. = 46·4cm
Substituting 35 -3 -31 149 -24
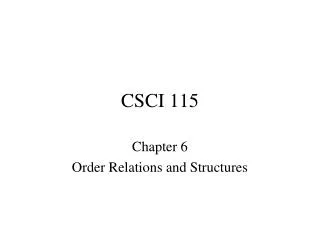
Same Sign Subtract 1 Solve 2x + y = 8 and 5x + y = 17 3x + 0 = 9 x = 3 Substitute x = 3 in Check in (not used directly to find y) 5 x3 + 2 = 17 2 - 2 1 so y = 2 2 x3 + y = 8 1 2 x = 3 and y = 2
Different Signs Add Solve 3x + 2y = 8 x - 2y = 0 4x+ 0 = 8 so x = 2 Substitute x = 2 in to find y 3 x2 + 2y = 8 so 2y = 2 so y = 1 Check in 2 - 2 x1 = 0 x= 2 and y = 1 1 2 1 + 2 1 2
Different amounts of x and y 1 Solve x + 2y = 11 and 3x + y = 18 Need either same number of x’s or y’sso gives 3x + 6y = 33 (SSS) 0 + 5y = 15 so y = 3 Sub y = 3 in Check in 3x 5 + 3 = 18 x= 5 and y = 3 2 x 3 1 3 - 3 2 x + 2x 3 = 11 so x = 5 1 2
Sometimes... • We need to multiply both equations Solve 5x + 2y = 15 and 3x- 3y = 51 1 2 • We could do x 3 then x 2 1 2 We would then have two new equations & which can be added to cancel out y as before 3 4
Word problems • A fruit machine contains 200 coins. These are either 20p or 50p. The total value of the coins is £65.20 • How many of each coin are in the machine? What is the value in pence of x 20p’s ?