Download
1 / 29
290 likes | 498 Vues
Educational Value-Added Analysis of Covariance Models with Error in the Covariates. S. Paul Wright EVAAS SAS Institute Inc. . Educational Value-Added Analysis of Covariance Models with Error in the Covariates. Introduction. Background. What is analysis of covariance (ANCOVA)?

E N D
Educational Value-Added Analysis of Covariance Models with Error in the Covariates S. Paul Wright EVAAS SAS Institute Inc.
Educational Value-Added Analysis of Covariance Models with Error in the Covariates Introduction
Background • What is analysis of covariance (ANCOVA)? • Mathematically, the model is: • Where: • : current-year score for student of teacher • : vector of covariates (“predictors”), including • prior-year test score(s) • student-level characteristics? • teacher/school/community characteristics? • : “effect” of -th teacher
Key Question of this Study • Question 1: If analysis of covariance (ANCOVA) is to be used for value-added modeling, and there is measurement error in the covariates, what is the most useful approach for dealing with the bias caused by measurement error? • Three options were considered: • Classical errors-in-variables (EIV) regression • Instrumental variables (IV) regression • ANCOVA with multiple covariates
Additional Questions of Interest • Question 2: Should be a fixed or random effect? • Question 3: Should include student characteristics? • Question 4: Should include teacher characteristics?
In Short, the Answers are… • What is the most useful approach for dealing with the bias caused by measurement error? • Use multiple ANCOVA (at least 3 prior test scores) • Should be a fixed or random effect? • Use random effects • Should include student characteristics? • Including student characteristics has little impact • Should include teacher/etc. characteristics? • Including teacher characteristics can be devastating
Educational Value-Added Analysis of Covariance Models with Error in the Covariates Methods of Analysis
Simulation Specifics included the following: • 1,000 data sets • 8 teachers • 20 students per teacher • 1 response (y) and 8 prior test scores (x): • Mean=50, Std. Dev.=21 (“NCE” scores) • True score correlation matrix (see next slide) • Based on empirical data • Assuming a reliability of .85 • Student poverty status (P) • Classroom poverty status ()
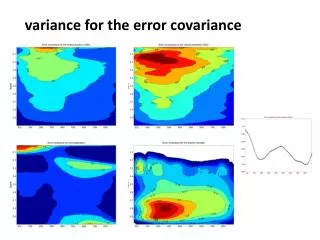
Simulation • Correlation Matrix • Upper right: empirical observed score correlations • Lower left: true score correlations (reliability = 0.85)
Simulation • Teacher effects: normal, mean=0, std. dev.=12 • = {-10.80, -18.67, -1.91, -5.95, +5.95, +1.91, +18.67, +10.80} • Student scores: • : true score associated with • previous-year score in same subject as response • : previous-year scores in other subjects • two-years-previous score in same subject as response • : two-years-previous scores in other subjects • using true-score correlation matrix
Simulation Assignment of students to teachers: • Sort students by the following value: • Scenario #1: ,random assignment. Assign students by increasing value of s, 1st 20 students to 1st teacher, 2nd 20 students to 2nd teacher, etc. • Scenario #2:.65, lower-achieving students are assigned to less effective teachers. Assign students by increasing value of s. • Scenario #3: .65, lower-achieving students are assigned to more effective teachers. Assign students by decreasingvalue of s.
Simulation • Student assignment to poverty status: • 50% of students designated as “in poverty” (), based on • lower achieving-students are more likely to be “in poverty” • Classroom poverty level () = classroom average of
Analysis Abbreviations for the Method of Estimation • FE: fixed-effects ANCOVA • Estimated effects constrained to sum to zero • RE: random-effect ANCOVA • Estimated effects automatically sum to zero • IV: instrumental variables model with fixed effects • Estimated effects constrained to sum to zero • EIV: errors-in-variables model with fixed effects • Estimated effects constrained to sum to zero
Analysis Abbreviations for the Covariates • _1x: one covariate {} • _2x: two covariates {} • _3x: three covariates {} • _4x: four covariates {} • _8x: eight covariates • _1i: one covariate {} with as instrument • _: one covariate {}, the true score for • _ : covariates and (student-level poverty indicator) • _: covariates and (teacher-level poverty indicator) • _: covariates and (classroom average true score) • _: covariates • _AOG: analysis of gains, response , no covariates
Analysis Software: • SAS/STAT® 9.2 • MIXED procedure for random-effects models • SAS/ETS® 9.2 • SYSLIN procedure for fixed-effects models including IV and EIV • RESTRICT statement enforces sum-to-zero constraint • For FE and IV, analyze raw data • For EIV, analyze corrected variance-covariance matrix
Educational Value-Added Analysis of Covariance Models with Error in the Covariates Results
Results • = true effect for j-th teacher • = estimated effect for j-thteacher in the k-th simulated dataset • = mean square error for j-th teacher • Bias = lack of accuracy (how far off target the estimates are) • Variance = lack of precision (how scattered the estimates are)
Results • Models with and , and • Bias2+ Variance = MSE
Scenario 1: Random Assignment of Students to Teachers Mean Square Error = Bias2 (red) + Variance (blue)
Lessons from Scenario 1 • Little or no bias in the displayed models • RE beats FE (slightly): bias vs. variance trade-off • AOG, IV, and EIV much noisier than ANCOVA • Use 3 or more prior test scores in ANCOVA • Adding student-level poverty indicator has little effect (RE_T versus RE_TP) • Adding teacher-level covariates is devastating both for bias and variance
Scenario 2: Assign Lower-Achieving Students to Less Effective Teachers Mean Square Error = Bias2 (red) + Variance (blue)
Lessons from Scenario 2 • Non-random assignment can produce serious bias • ANCOVA with 3+ prior scores reduces bias (and variance) • RE beats FE: less variance and less bias! • AOG is now biased -- IV and EIV are not • MSE for AOG, IV, and EIV are still higher than ANCOVA • Adding student-level poverty indicator has little effect (RE_T versus RE_TP) • Adding teacher-level covariates is devastating
Scenario 3: Assign Lower-Achieving Students to More Effective Teachers Mean Square Error = Bias2 (red) + Variance (blue)
Lessons from Scenario 3 • Non-random assignment can produce serious bias • FE now beats RE due to much less bias • ANCOVA with 3+ prior scores reduces bias (and variance) • AOG, IV, and EIV have little or no bias • MSE for AOG, IV, and EIV comparable to 3+ ANCOVA • Adding student-level poverty indicator has little effect (RE_T versus RE_TP) • Adding teacher-level covariates is devastating
Summarizing the Bias in Scenarios 2 and 3 • In Scenario 2, bias and shrinkage act in opposite directions, giving the RE model an advantage. • In Scenario 3, bias and shrinkage act in the same direction, giving the RE model a disadvantage.
Additional Models (not shown) • Fixed-effect models with after-the-fact shrinkage • ANCOVA, AOG, IV, and EIV • results are intermediate between FE and RE
In Conclusion, the Answers are… • What is the most useful approach for dealing with the bias caused by measurement error? • Use multiple ANCOVA (at least 3 prior test scores) • Should be a fixed or random effect? • Use random effects • Should include student characteristics? • Including student characteristics has little impact • Should include teacher/etc. characteristics? • Including teacher characteristics can be devastating
Afterword: The Excluded Contender Repeated Measures Analysis of Variance (RM-ANOVA) • All student test scores on “left hand side” • Why excluded: no covariates, so no bias due to measurement error in covariates • Examples: • AOG • EVAAS “MRM” including “layered model” • HLM cross-classified model • RAND complete persistence model • Some panel data models
Afterword RM-ANOVA versus ANCOVA • Lord’s Paradox in analysis of pre-post measurements • Example: Children’s height over time • Growth = Post minus Pre • “Growth”? = Observed-Post minus Predicted-from-Pre • Scale requirements: meaningful differences • Vertical scales • Standardized scores (z-scores) • Normalized scores (rank-based z-scores, NCEs)