Download
1 / 38
380 likes | 482 Vues
Statistical Process Control For Public Health: Run Charts. William Riley, PhD Professor and Director School For the Science of Health Care Delivery Arizona State University Open Forum Meeting for Quality Improvement in Public Health June 12, 2013 Milwaukee, WI. Objectives.

E N D
Statistical Process Control For Public Health: Run Charts William Riley, PhD Professor and Director School For the Science of Health Care Delivery Arizona State University Open Forum Meeting for Quality Improvement in Public Health June 12, 2013 Milwaukee, WI
Objectives • By the end of this presentation, you will be able to: • Describe 4 generations of analysis • Identify and explain the difference between special cause and common cause variation • Analyze a run chart using 2 tests for special cause • Apply run charts and control charts in a public health setting • Explain process stability and capability • Define and apply Statistical Process Control
Public Health Policy Analysis • Process: a series of steps to produce an outcome • All processes have variation • The underlying process determines performance • Understanding and reducing variation in process is goal
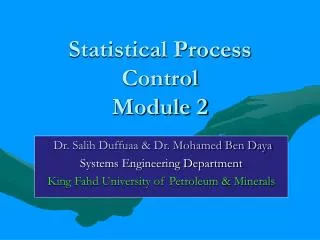
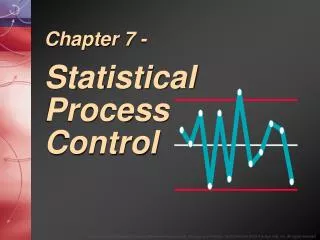
Statistical Process Control • A method to analyze data from ongoing processes to make decisions about the process in order to control the quality of service. • Involves the use of control charts to track a process over time to determine its performance. • A process is controlled when its variability in the future can be predicted. • A set of analytic methods for improvement of processes and outcomes through the analysis of process stability and capability
Static and Dynamic Data AnalysisFour Generations • Static Analysis • First Generation: Tables of Data, Comparison of Summary Measures • Dynamic Analysis • Second Generation: Trend Line • Third Generation: Run Chart • Fourth Generation: Control Chart
Static and Dynamic Data Analysis and Presentation • Case Study: • The Smith County Health Department was concerned about the STD rate in a high risk population. • A program was initiated to try harder to do everything right in order to improve. • After 2 years, the following results were shown
Discussion • Looking at the following 4 slides (7-10), consider these questions: • How is the information different? • Which slide is most accurate? • Which is most helpful?
Port Gamble S’Klallam Tribe Monthly Clinic Visits: 2008-2009
Port Gamble S’Klallam Tribe Monthly Clinic Visits: 2008-2009
Port Gamble S’Klallam Tribe Trend Chart: Number of Clinic Visits Per Month June 2008-May 2010
Port Gamble S’Klallam Tribe Trend Chart: Number of Clinic Visits Per Month June 2008-May 2010
Port Gamble S’Klallam Tribe Trend Chart: Number of Clinic Visits Per Month June 2008-May 2010
Port Gamble S’Klallam Tribe Trend Chart: Number of Clinic Visits Per Month June 2008-May 2010
Discussion • All process have variation • When is the change in performance meaningful?
Run Chart • A running record of process behavior over time. • Easily understood by all, • Can be used on any type of process and any type of data. • Requires no statistical calculations, can detect some special causes.
Port Gamble S’Klallam Tribe Run Chart: Number of Clinic Visits Per Month June 2008-May 2010
Run Chart: Determining Runs • A run is one or more consecutive data points on the same side of the median. • Do not count a point if it is on the centerline. (Put a box around it and ignore) • “Useful Observations” • Subtract any observation that falls on median. • Draw circle around each run, and count the number of runs.
Run Chart: 2 Tests to Identify Special Cause Determining a Trend • Test 1 – Long run: • If 7 or more in run( When less than 20 “useful observations”) When 20 or more “useful observations” , then 8 or more data points needed for a run. • Test 2 – Trend: • An unusually long series of consecutive increase or decrease.
Two Types of Variation • Special Cause • A noticeable shift or trend in data over time • Process is unstable or unpredictable • Process is out of statistical control • Not present in every process • Common Cause • Inherent in every process • Reflects a stable process because variation is predictable • Is random variation
Port Gamble S’Klallam Tribe Run Chart: Number of Clinic Visits Per Month June 2008-May 2010 Special Cause A noticeable shift or trend in data over time Process is unstable or unpredictable Process is out of statistical control Not present in every process
Port Gamble S’Klallam Tribe Run Chart: Number of Clinic Visits Per Month June 2008-May 2010 Special Cause A noticeable shift or trend in data over time Process is unstable or unpredictable Process is out of statistical control Not present in every process
Interpretation Special Cause A noticeable shift or trend in data over time Process is unstable or unpredictable Process is out of statistical control Not present in every process • How do you interpret the run chart? • What do you recommend?
Run Chart and Test for Special CauseCase Study: Waiting Time in Smith County WIC Clinic Special Cause A noticeable shift or trend in data over time Process is unstable or unpredictable Process is out of statistical control Not present in every process • A key quality indicator of client satisfaction is the amount of time spent in the waiting room. • A 7 week analysis was conducted to determine the wait time at the WIC clinic. • The “wait time” is defined as the number of minutes from the time the client presents at the reception desk until the client is seen by the WIC specialist. • Please analyze the run chart for 2 test of Special Cause
Another Case Study Special Cause A noticeable shift or trend in data over time Process is unstable or unpredictable Process is out of statistical control Not present in every process • Please make a run chart • How do you interpret? • What do you recommend?
Smith County WIC Clinic Special Cause A noticeable shift or trend in data over time Process is unstable or unpredictable Process is out of statistical control Not present in every process
Smith County WIC Clinic Special Cause A noticeable shift or trend in data over time Process is unstable or unpredictable Process is out of statistical control Not present in every process
Noise and Signal Special Cause A noticeable shift or trend in data over time Process is unstable or unpredictable Process is out of statistical control Not present in every process • Noise • Common cause variation inherent in every process. • Tampering: responding to common cause variation. • Signal • A special cause variation that has an assignable reason. • A definite indication that the process has changed.
Control Charts Special Cause A noticeable shift or trend in data over time Process is unstable or unpredictable Process is out of statistical control Not present in every process
Port Gamble S’Klallam Tribe XChart: Number of Clinic Visits Per Month June 2008-May 2010 Special Cause A noticeable shift or trend in data over time Process is unstable or unpredictable Process is out of statistical control Not present in every process
Smith County WIC Clinic Special Cause A noticeable shift or trend in data over time Process is unstable or unpredictable Process is out of statistical control Not present in every process
Discussion Special Cause A noticeable shift or trend in data over time Process is unstable or unpredictable Process is out of statistical control Not present in every process • Please analyze the preceding control chart • What conclusions can you draw? • Why would my QI team and/or management in my agency want to know how to do this?
Process Capability and Process Stability Special Cause A noticeable shift or trend in data over time Process is unstable or unpredictable Process is out of statistical control Not present in every process • Process Capability • The performance level of a stable process • Process Stability • Whether process is in control and produces predictable results.
Process Improvement and Process Re-engineering Special Cause A noticeable shift or trend in data over time Process is unstable or unpredictable Process is out of statistical control Not present in every process • Process Improvement • When special cause is present • Process is not stable, not capable • Conduct root cause analysis • Process Re-engineering • No special cause present, process stable • Process is capable, but not performing to specifications.
Special Cause A noticeable shift or trend in data over time Process is unstable or unpredictable Process is out of statistical control Not present in every process Qi coach roundtables 4:30-5:30 in the Holladay Room