Measuring infiltration:
Mm decline in level 0 10 20 30. 0 1 2 3 4 5 Minutes. Measuring infiltration:. During first half minute. Place a sawn off tube in the ground and fill to a marked line with water. After 30 secs measure new level.

Measuring infiltration:
E N D
Presentation Transcript
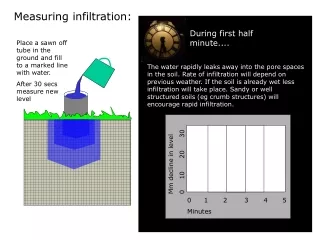
Mm decline in level 0 10 20 30 0 1 2 3 4 5 Minutes Measuring infiltration: During first half minute.... Place a sawn off tube in the ground and fill to a marked line with water. After 30 secs measure new level The water rapidly leaks away into the pore spaces in the soil. Rate of infiltration will depend on previous weather. If the soil is already wet less infiltration will take place. Sandy or well structured soils (eg crumb structures) will encourage rapid infiltration.
Mm decline in level 0 10 20 30 0 1 2 3 4 5 Minutes Measuring infiltration: End of first half minute.. Record new water level and top up again The new water level is recorded and the water level rapidly refilled to the original marker line. The timer continues. The first point can be plotted on the graph.
Mm decline in level 0 10 20 30 0 1 2 3 4 5 Minutes Measuring infiltration: After first full minute.. Record new water level and top up again In the second half minute the water level dropped less rapidly because there are fewer “unfilled soil pores” near the infiltration ring. Capillary action in dry soil is effective at “sucking in” water. Once the soil is wet, capillary forces become less important and infiltration slows.
Mm decline in level 0 10 20 30 0 1 2 3 4 5 Minutes Measuring infiltration: Second minute Record new water level and top up again Depending on the difference between the first and second readings you may wish to either (i) continue recording at 30 second intervals or (ii) record every minute only. In this example we will next measure at the end of the second minute as shown below.
Final infiltration rate = 9mm/min Mm decline in level 0 10 20 30 0 1 2 3 4 5 Minutes Measuring infiltration: Subsequent minutes Record new water level and top up again As the soil beneath the infiltration ring becomes saturated the main control on rate of infiltration is gravity pulling water through the matrix of pore spaces. This represents the true infiltration rate of the soil. This is normally given in mm/minute and can be read off the graph as the final horizontal line.
Measuring infiltration: Factors affecting infiltration rates - 1 Mm decline in level 0 10 20 30 Infiltration curves can give information about 1) differing weather conditions for the same soil 2) differing soil types for the same weather. In the top graph, infiltration rates are plotted for the same soil in different weather conditions - yellow = drought; red = normal; blue = wet. Steepness of the curve reflects how long it takes to fill soil pore spaces - this depends on amount of water already there. The final flat part of the curve represents the rate of flow through full pore spaces - ie an indication of soil porosity. 0 1 2 3 4 5 Minutes Mm decline in level 0 10 20 30 In the lower graph, infiltration rates have been plotted for different soils in similar weather conditions. Steepness reflects how long it takes to fill the soil pore spaces - dependent on soil porosity (because weather was the same for each). The final level represents rate of flow through full pore spaces - also dependent on soil porosity. In these examples green is the soil with highest infiltration rate and yellow the lowest. 0 1 2 3 4 5 Minutes
Tractors on wet soil destroy soil structure Good infiltration Poor infiltration Measuring infiltration: Factors affecting infiltration rates - 2 Management of soil influences infiltration rates. Management can influence positively or negatively. The diagram show a soil ped - a collection of textural particles (clay, sand etc) glued together by organic material such as humus (shown brown) and capillary forces of water beads between soil grains (shown blue). After heavy rainfall the soil pores fill with water and instead of capillary action holding grains together, excess water pressure pushes them apart (“positive pore water pressure”). This makes the peds very fragile. If the soil is stressed in these conditions - by heavy machinery (eg tractors) or trampling by people or livestock - the peds break down entirely, resulting in a structureless mass described as a “poached soil”. The destruction of peds means that the large pores between peds disappear, vastly reducing infiltration rates
Managing infiltration: Managing infiltration structure positively. Good infiltration is a key to a good soil, allowing drainage (to avoid waterlogging) and aeration (to allow micro-organisms to breed and breathe!). Good infiltration depends to a large extent on good soil structure. Soil structure is currently declining in many parts of the developed world because artificial fertilizer has been used instead of organic manure. Whilst artificial fertilizer puts the right nutrients in the ground it does not provide the raw organic matter for glueing textural particles into peds. Structure can be improved by: 1) adding organic fertilizers to the soil 2) maintaining an effective crop rotation 3) ploughing the soil to break up poached layers 4) avoid cultivating the soil during wet conditions Cross section of sloping field Higher infiltration rates result in lower erosion rates as water infiltrates underground, leaving little for surface erosion.
This is the final slide - press back-arrow to go back or any other key to end the show.