Download
1 / 8
80 likes | 186 Vues
Figure 1. Medicaid and CHIP Leaders’ Views of Their State’s Top Children’s Health Priorities. Number of states. (N=53). Source: Health Management Associates/Commonwealth Fund Child Health Quality Survey, 2009. Figure 2. Performance Measures Currently in Use.

E N D
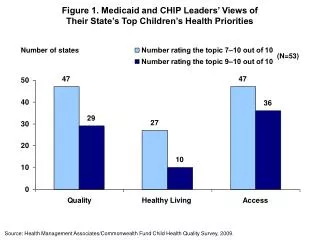
Figure 1. Medicaid and CHIP Leaders’ Views ofTheir State’s Top Children’s Health Priorities Number of states (N=53) Source: Health Management Associates/Commonwealth Fund Child Health Quality Survey, 2009.
Figure 2. Performance Measures Currently in Use Percent of programs using each measure Source: Health Management Associates/Commonwealth Fund Child Health Quality Survey, 2009.
Figure 3. Other State-Developed Measures Source: Health Management Associates/Commonwealth Fund Child Health Quality Survey, 2009.
Figure 4. Beliefs of State OfficialsAbout the Adequacy of Current Measures Source: Health Management Associates/Commonwealth Fund Child Health Quality Survey, 2009.
Figure 5. States Reporting an Interest in New Measures Percent of programs indicating each area Source: Health Management Associates/Commonwealth Fund Child Health Quality Survey, 2009.
Figure 6. Improved Measurement Strategies or MethodologiesThat States Report Would Be Beneficial Percent of programs reporting each improvement Source: Health Management Associates/Commonwealth Fund Child Health Quality Survey, 2009.
Figure 7. States’ Use of Incentives to Promote Quality Improvement Percent of programs using each incentive Source: Health Management Associates/Commonwealth Fund Child Health Quality Survey, 2009.
Figure 8. Programs’ Priorities for Technical Assistance Percent of programs indicating each initiative Source: Health Management Associates/Commonwealth Fund Child Health Quality Survey, 2009.