Validation of the PLS-DA model
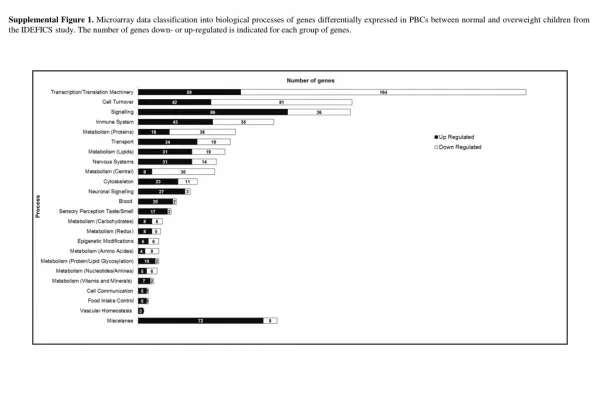
Supplemental Figure 1. Microarray data classification into biological processes of genes differentially expressed in PBCs between normal and overweight children from the IDEFICS study. The number of genes down- or up-regulated is indicated for each group of genes.

Validation of the PLS-DA model
E N D
Presentation Transcript
Supplemental Figure 1. Microarray data classification into biological processes of genes differentially expressed in PBCs between normal and overweight children from the IDEFICS study. The number of genes down- or up-regulated is indicated for each group of genes.
SupplementalFigure2. Validation of the PLS-DA model. PLS-DA was performed using the Excel add-in Multibase package (Numerical Dynamics, Japan), for discrimination of individuals with high and low levels of triglycerides (HighTG; LowTG) within normal weight and overweight children (NW; OW), including 1,077 genes differentially expressed between normal weight and overweight. Validation of the PLS-DA model
Supplemental Table 1. List of genes and the corresponding sequence of primers used for the array validation by RT-qPCR. All primers were obtained from Sigma (Sigma-Aldrich Quimica SA, Madrid, Spain. P-values of microarray data (Limma t-test), RT-qPCR (Student’s t-test) and fold change (FC) values (calculated as the difference between log2-transformed means of gene expression data, for microarray data) are indicated; +, indicates up-regulation; -, down-regulation.
Supplemental Table 2. Genes with the highest loading scores for PC1 and PC2 resulting from the Partial least square discriminant analysis (PLS-DA) plots involving 1,077 genes differentially expressed between normal weight and overweight (Figure 2A).
Supplemental Table 3. Genes with the highest loading scores for PC1 and PC2 resulting from Partial least square discriminant analysis (PLS-DA) for discrimination of individuals with high and low levels of triglycerides within normal weight and overweight children, including 1,077 genes differentially expressed between normal weight and overweight (Figure 3).