Download

1 / 27
270 likes | 396 Vues
Simulation models are crucial for analyzing and optimizing real-life systems, yet validation is often overlooked. This article explores how accurately a simulation reflects real operations and questions the reliability of its results. It discusses validation methods such as comparing model outcomes with actual data and employing variance reduction techniques (VRT) to enhance accuracy. Techniques like antithetic and control variates are highlighted, emphasizing the need for a structured approach to validate simulation models, particularly in stochastic environments, to ensure meaningful insights.

E N D
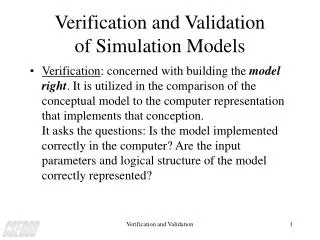
Important but neglected • Thequestion is • How accurately does a simulation model (or, for that matter, any kind of model) reflect the operations of a real-life system? • How confident can we be that the obtained simulation results are accurate and meaningful? • Performance of an unimplementedsystem can only be measuredbysimulation, ex. switch • how does one make sure that the model that will be constructed is a valid representation of the system under study? • Ifwehavethesystemandımproveit • The model of the existing system can bevalidated by comparing its results against actual data obtained from the system under investigation
CheckList • the pseudo-random number generators • uniformly distributed in (0,1) • satisfy statistical criteria of independence • the stochastic variategenerators • Similarquestionshould be answeredforstochasticvarıates • the logic of the simulation program • This is a rather difficult task • print out the status variables ,eventlıstsoranyrelevant data • Relationshipvalidity • Quite frequently the structure of a system under study is not fully reflected down to its very detail in a simulation model • Outputvalidity • Ifactual data is data we can comparethesimulatıon model results
VarianceReductionTechniques VRT • The accuracy of an estimate is proportional to 1/√ n , where n is the sample size. • One way to increase the accuracy of an estimate increase n • To halvethe confidence interval 4n shuld be used • BUT it requires long time and expensive ( memory and cpu) • An alternative way to increasing the estimate's accuracy is to reduce its variance. • If one can reduce the variance of an endogenously created random variable without disturbing its expected value, then the confidence interval width will be smaller, for the same amount of simulation • Techniques aiming at reducing the variance of a random variable are known as Variance Reduction Techniques
VRT • Variance reduction techniques require additional computation in order to be implemented. • Not for sure whether a variance reduction technique will effectively reduce the variance in comparison with straightforward simulation. • Common practice is to carry out a plot experiment • a) the antithetic variates technique and • (b) the control variates technique.
The antithetic variates technique AVT • This is a very simply technique to use and it only requires a few additional instructions in order to be implemented • No general guarantee of its effectiveness can be given • Therefore, a small pilot study may be useful in order to decide whether or not to implement this technique.
AVT • Let X be an endogenously created random variable • realizations of X obtained in a simulation run. • observations of X obtained in a second simulation run. • Now, let us define a new random variable
AVT cont. • More specifically, let indicates the random variable X as observed in the ith simulation run. We have • Thus, the expected value of this new random variable Z is identical to that of X. Now, let us examine its variance. We have
AVT where ρ is the correlation between X(1) and X(2)
AVT • In order to construct an interval estimate of E(X), we use random variable Z. • we can cause Var(Z) to become significantly less than Var(X). This is achieved by causing ρ to become negative. • In the special case where the two sets of observations X1 and X2 are indipendent of each other we have that p=0 hence Var(Z)=Var(X)/2 • The antithetic variates technique attempts to introduce a negative correlation between the two sets of observations.
Example • As an example, let us consider a simulation model of a single server queue, and let X and Y indicate the waiting time in the queue and the interarrival time respectively. • If Y is very small, then customers arrive faster and, therefore, the queue size gets larger. • The larger the queue size, the more a customer has to wait in the queue, i.e. X is larger. • On the other hand, if Y is large, then customers arrive slower and, hence, the queue size gets smaller. Obviously, the smaller the queue size, the less a customer has to wait in the queue, i.e., X is small. • Therefore, we see that X and Y can be negatively correlated.
Example Cont. • This negative correlation between these two variables can be created in a systematic way as follows. • Let F(t) and G(S) be the cumulative distribution of the inter- arrival and service time respectively • Let ri and vi be pseudo-random numbers. • Then, ti=F-1(ri) andsi=G-1(vi) are an interarrival and a service variate. These two variates can be associated with the ith simulated customer • An indication of whether the queue is tending to increase or decrease can be obtained by considering the difference di=ti-si. • This difference may be positive or negative indicating that the queue is going through a busy or slack period respectively
Ex. Contrast • Now, let us consider that in the second run, we associate pseudo-random number r’i and v’i with the ith simulated customer, so that below equation has the opposite sign of di. • That is, if the queue was going through a slack (busy) period in the first run at the time of the ith simulated customer, now it goes through a busy (slack) period • It can be shown that this can be achieved by simply setting r’i = 1-ri and v’i =1-vi.
We make use of two controllable variables, Y1 and Y2, indicating the interarrival time and the service time respectively. • These two random variables are strongly correlated with X, the waiting time in the queue. • Yj(1) and Yj(2), j=1,2 can be negatively correlated by simply using the compliment of the pseudo-random numbers used in the first run.
Implementing technique • Simulate the single server queue, and let , x1 (1), x2(1), ..., xn(1) be n i.i.d observations of X. ( • Re-run the simulation, thus replicating the results, using pseudo-random numbers (ri,vi)=(1-r,1-vi). Let x1 (2), x2(2), ..., xn(2) be realization of X. Construct the interval estimate of E(X) using random variable z as described above. • Obviously, the correlation between the two samples of observations is as good as the correlation between Y1j and Yj2, j=1,2. Independent and identically distributed
implemented in simulation of an M/M/1 queue • The random variable X is the time a customer spends in the system • The i.i.d. observations of X were obtained by sampling every 10th customer. • Using the antithetic variates technique, we obtained a confidence interval of 13.52±1.76 • antithetic variates techniques were employed using two sets of observations each of size equal to 300, i.e., a total of 600 observations.
In the above example, the antithetic variates technique worked quite well. However, this should not be construed that this method always works well. • In particular, in the following example, an M/M/2 queuing system was simulated
The control variates technique • This method is otherwise known as the method of Concomitant Information. • Let X be an endogenously created random variable whose mean we wish to estimate. • Let Y be another endogenously created random variable whose mean is known in advance known as the control variable. • Random variable Y is strongly correlated with X.
Example example of a single server queue • Let X be the time a customer spends in the system Then X is negatively correlated with the random variable Y representing the inter-arrival time. (It is also positively correlated with the random variable representing the service time.) • Let x1, x2, ..., xn be n i.i.d. observations of X • Likewise, let y1, y2, ..., yn be n observations of Y • yi is the inter-arrival time associated with the xi observation.
Cont. • confidence interval for the estimate of E(X) using
a • where a is a constant to be estimated and Y is positively or negatively correlated to X • Again, we have E(Z)=E(X) • so that Z has a smaller variance than X if • We select a so that to minimize the right-hand side given in the above expression
Cont. • Now, substituting into the expression for Var(Z) we have • Thus, we always get a reduction in the variance of Z for the optimal value of a, provided that X and Y are correlated • The determination of a* requires a priori knowledge of the Var(Y) and Cov (X,Y) • The definition of Z can be further generalized using multiple control variables, as follows
Cont. • where ai, i=1,2,...,m, are any real numbers. In this case,