Download
1 / 45
450 likes | 582 Vues
Role of Air-Sea Interaction on the Predictability of Tropical Intraseasonal Oscillation (TISO). Xiouhua Fu International Pacific Research Center (IPRC) SOEST, University of Hawaii (UH) at Manoa Honolulu, Hawaii 96822.

E N D
Role of Air-Sea Interaction on the Predictability of Tropical Intraseasonal Oscillation (TISO) Xiouhua Fu International Pacific Research Center (IPRC) SOEST, University of Hawaii (UH) at Manoa Honolulu, Hawaii 96822 http://www.soest.hawaii.edu/~xfu
OUTLINE Motivation Review of Previous Studies Air-Sea Coupling on TISO Predictability Best Lower Boundary Condition for TISO Predictability Summary
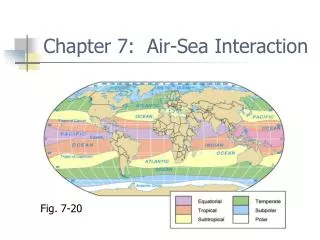
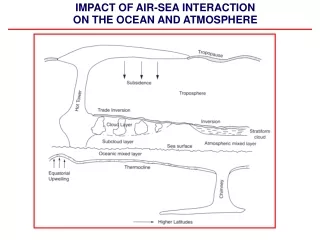
Intra-Seasonal Oscillation WCRP-COPES (2005-2015)
Review of Previous Studies on the Predictability of Tropical Intraseasonal Oscillation (TISO)
Definition of Predictability Potential Predictability: The extent to which prediction is possible if “an optimum procedure” is used. Perfect model assumption and subject to initial condition errors Practical Predictability: The extent to which we ourselves are able to predict by the “best-known procedures”. Subject to both model errors and initial condition errors Adopted from E. N. Lorenz, 2006: Predictability - a problem partly solved. Chapter 3 in “Predictability of Weather and Climate”, Cambridge University Press, 702pp.
Two Methods to Measure the Predictability Ratio of Signal- to- Forecast Error Lead Time Anomaly Correlation Coefficient (ACC) 1.0 0.5 Lead Time
Ratio of Signal-to-Forecast Error Control run Perturbed Forecasts (Signal) L=25 days (Forecast Error) Waliser et al. (2003)
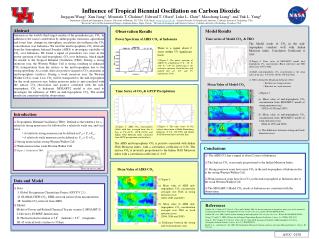
Estimate of TISO Predictability from Observations Wet Dry X X X X (70-90E,15-25E) Signal vs. Error Dry-to-Wet Error Signals The Dry phase Is more predictable than the Wetphase X X Wet-to-Dry Error (Days) Goswami and Xavier (2003)
Two Different Error-Growth Regimes Large-scale Subsidence Strong Convective Instability Dry Wet Dry Slow Error Growth Fast Error Growth
Potential Predictability of TISO Rainfall in NASA GLA AGCM Forecast error variance Signal Domain: (12oN-16oN, 117.5oE-122.5oE): SCS Waliser et al. (2003)
Potential Predictability of TISO VP200 and Rainfall in NCEP Seasonal Forecasting Model Perfect Initial/Boundary Conditions Perfect Boundary Conditions (ACC) Perfect Initial Conditions Reichler and Roads (2005)
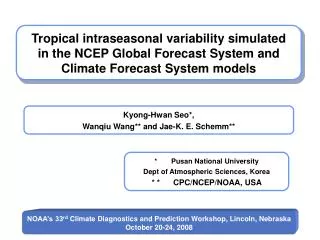
Practical Predictability of TISO U200 in NCEP Seasonal Forecasting Model Winter Summer ( 7 days) Seo et al. (2005)
UH Hybrid coupled GCM (UH_HcGCM) • Atmospheric component: • ECHAM-4 T30L19 AGCM • (Roeckner et al. 1996) • Ocean component: • Wang-Li-Fu intermediate upper ocean model (0.5ox0.5o) • (Wang et al. 1995; Fu and Wang 2001) • Wang, Li, and Chang (1995): upper-ocean thermodynamics • McCreary and Yu (1992): upper-ocean dynamics • Jin (1997) : mean and ENSO (intermediate fully coupled model) Zebiak and Cane (1987): ENSO (intermediate anomaly coupled model) • Fully coupling without heat flux correction • Coupling region: Tropical Indian and Pacific Oceans (30oS-30oN) • Coupling interval: Once per day
Role of Air-Sea Coupling on TISO Predictability Fu et al. 2007, JAS
Experimental Design • 20 TISO events in 15-year coupled control run • 4 phases for each TISO event • “Twin” perturbed experiments starting from each phase (Lorenz 1963; Waliser et al. 2003) For both the atmosphere-ocean coupled model and atmosphere-only model, each with 160 forecasts Methods to Measure ISO Predictability • Signal-to-forecast error ratio • ACC
Filtered Rainfall over (5oS-5oN, 80oE–100oE) Phase 3 Phase 2 Phase 4 Phase 1
Air-Sea Coupling Extends the Predictability of Tropical Intraseasonal Oscillation ATM Forecast Error Signal CPL Forecast Error [ATM: 17 days; CPL: 24 days] Fu et al. (2007)
ACC between Target Fields and Forecasts Target Forecast 0.91 0.86 0.84 0.73 0.43
TISO Predictability is Phase-dependent Coupled Forecasts Atmosphere-only Forecasts Break phase Active phase
Summary I The predictability of TISO-related rainfall in UH hybrid coupled GCM reaches about 24 days averaged over the Asian-western Pacific region (10oS-30oN, 60oE-160oE) when measured with the signal-to-error ratio. The averaged predictability in the atmosphere-only model is about 17 days. This result suggests that air-sea coupling is able to extend the predictability of the TISO by about a week. The break phase of TISO is more predictable than the active phase.
Best Lower Boundary Condition for TISO Predictability Fu et al. 2007 MWR, in press
What are the best SST configurations (e.g., tier- one vs. tier-two) for TISO hindcasts and forecasts? Could air-sea coupling extend the weather predictability?
Experimental Design • 2 TISO events in a coupled control run • 4 phases for each TISO event • 10 ensemble forecasts starting from each phase of selected events under 5 different SST settings • Data Processing • TISO: 20-90-day filtered daily rainfall • Weather: unfiltered daily rainfall Method to Measure TISO Predictability • Signal-to-forecast error ratio • ACC
Ensemble Experiments With Five Different SST Configurations
Filtered rainfall over (80oE–100oE, 5oS-5oN) Phase 3 Phase 2 Phase 4 Phase 1
Event-I Event-II Control cases Coupled forecasts (CPL) Ten-ensemble-mean Atmosphere-only forecasts (ATM) Rainfall averaged over (65oE-120oE)
Ensemble Rainfall Evolutions of CPL and ATM Forecasts for Event-II
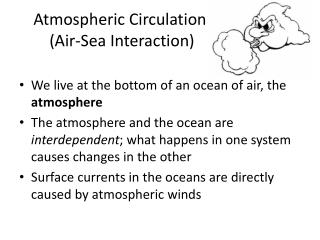
SSTs in Five Experiments Control Mixed-layer “Smoothed” Coupled/Daily Damped persistent
TISOpredictability measured by signal-to-error ratio ATM Forecast Error CPL Forecast Error Signal ATM/ATMp: 24 days CPL/ATMd: 34 days Individual ensembles
TISOpredictability measured by ACC ACC ATM/ATMp:21 days CPL/ATMd: 30 days Individual ensembles
TISOpredictability measured by ACC ACC ATM/ATMp: 30 days CPL/ATMd: 42 days Ensemble means
Coupling also extends the predictability of weather ATM Forecast Error Signal CPL Forecast Error ATM/(Negative): 8 days CPL/(Positive): 16 days (During break-to-active transition)
Summary II • The TISO predictability in UH_HcGCMreaches about 30 days averaged over the Southeast Asia. The predictability in the stand-alone atmospheric model is about 20 days. Interactive air-sea coupling extends the TISO predictability by about 10 days. During break-to -active transition, coupling also significantly extends weather predictability. • Tier-two system could reach similar TISO predictability as tier-one system, suggesting that using observed high-frequency SST for TISO hindcasts and using interactive air-sea coupling and forecasted daily SST for real-time forecastsare good options.
Why does the daily SST-forced atmospheric forecasts (ATMd, tier-two) have similar predictability with the coupled forecasts (CPL, tier-one)?
Air-sea coupling maintains correct phase relationship between ISO rainfall and underlying SST Fu et al. (2003), Fu and Wang (2004)
Evolutions of SST and Rainfall Anomalies in the CPL and ATM Forecasts
Reconcile with Previous Findings Phase relationship between SST and rainfall in three different forecasts (Coupled;Daily-forced; and Daily-forced with different initial conditions)
Mean Vertical Shear in First-month Forecasts of CPL and ATM Event-I Event-II Control (Solid), CPL (Long-dash), ATM (Dotted)