Download
1 / 40
400 likes | 532 Vues
Measure Up! Benchmark Assessment Quality Assurance Process. RCAN September 10, 2010. Measure Up!. Objective To monitor and improve Benchmark Assessments in order to attain the most accurate possible measurement of student achievement with respect to California Content Standards Tests.

E N D
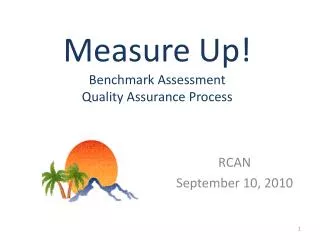
Measure Up!Benchmark Assessment Quality Assurance Process RCAN September 10, 2010
Measure Up! Objective To monitor and improve Benchmark Assessments in order to attain the most accurate possible measurement of student achievement with respect to California Content Standards Tests.
Measure Up! Evolving Components • Content—Structure & Course Guides • Predictability • Correlation of Benchmark Exams to CST scores • Association of Benchmark Exams with CST Performance Levels • Item Analysis • Difficulty • Discrimination • Representative of CST items
PSUSD Benchmark Structure CST ~153 ID 60 to 75 Items Blueprint Aligned Benchmark #1 ~45 ID ~20-35 Items 1st 45 ID Paced Standards Partial Match to CST Benchmark #3 ~135 ID ~20-35 Items 3rd 45 ID Paced Standards Partial Match to CST Benchmark #2 ~90 ID ~20-35 Items 2nd 45 ID Paced Standards Partial Match to CST
Predictability 2008-2009 Algebra I (8th Grade) Aggregation of 3 Benchmarks 2008-209 Algebra I (8th Grade) CST
38 Prof = 38 Algebra I CST 2009 (8th Grade) Algebra I BM 08-09 (8th Grade)
N = 119 N = 125 N = 51 N = 23 N = 5
Predictability 2008-2009 ELA 10th Grade Aggregation of 3 Benchmarks 2008-209 ELA 10th Grade CST
53 Prof = 53 ELA 10th Gd CST 2009 ELA 10th Gd BM 08-09
N = 326 N = 249 N = 151 N = 36 N = 26
Predictability 2008-2009 US History 11th Grade Aggregation of 3 Benchmarks 2008-209 US History 11th Grade CST
r = .46 63 Prof = 40 US His 11th Gd CST 2009 US His 11th Gd BM 08-09
N = 142 N = 116 N = 72 N = 68 N = 7
Predictability 2008-2009 Science 8th Grade Aggregation of 3 Benchmarks 2008-209 Science 8th Grade CST
r = .77 44 Prof = 39 Science 8th Gd CST 2009 Science 8th Gd BM 08-09
N = 494 N = 307 N = 275 N = 84 N = 24
Predictability 2008-2009 Math 6th Grade Aggregation of 3 Benchmarks 2008-209 Math 6th Grade CST
r = .84 48 Prof = 43 Math 6th Gd CST 2009 Math 6th Gd BM 08-09
N = 460 N = 393 N = 164 N = 224 N = 31
Predictability 2008-2009 ELA 4th Grade Aggregation of 3 Benchmarks 2008-209 ELA 4th Grade CST
r = .80 102 Prof = 44
N = 388 N = 334 N = 176 N = 88 N = 93
Item Difficulty • The p value for any item • percentage of correct answers • usually in decimal form • Ideally p value range is .30 to .80 for most items • For example • p value of .28 = 28% of the test takers got the item right • p value of .75 = 75% of the test takers got the item right • P value of .95 = 95% of the test takers got the item right
Item Discrimination • Is item “discriminating” appropriately between higher & lower scoring students • Discrimination Index (DI) = difference between how upper half and lower half of students score on an item • DI ranges between -1 and +1 • We want items to discriminate positively
Representative of CST Items and our continual Revision Process 2008-2009 7th Grade Math 3rd Benchmark 2009-2010 7th Grade Math 3rd Benchmark
2008-2009 Item 7NS1.6 p = .33 DI = .34
RTQ for 7NS1.6 CST = 1 RTQ = 1
2009-2010 Item 7NS1.6 p = .42 DI = .31
Additionally… • Item #3 replaced (as #3) with item modeled after RTQ # 16 (7NS1.7*)—CST = 5, RTQ = 7 • Item #15 replaced (as #13) with item modeled after RTQ #47 (7AF1.5) • Item #s 23 & 24 replaced (as #s 21 & 22) with items modeled after RTQ #s 89 & 88 (7MG3.4*)
Measure Up! Next Steps • Benchmark Exam Structure • Institutionalize System • CAHSEE • Writing Prompt • Discrimination • Distractor Shaping