Download
1 / 16
190 likes | 1.34k Vues
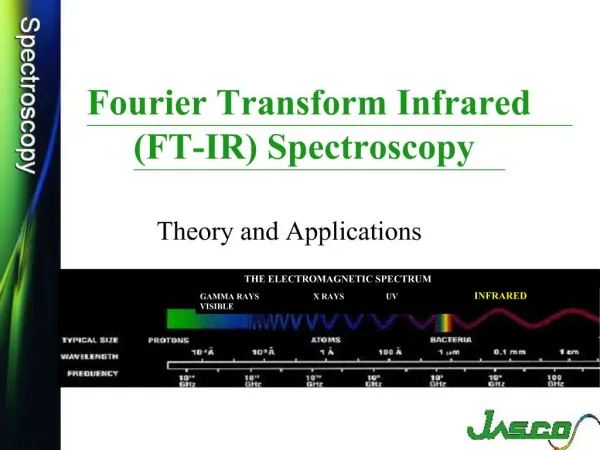
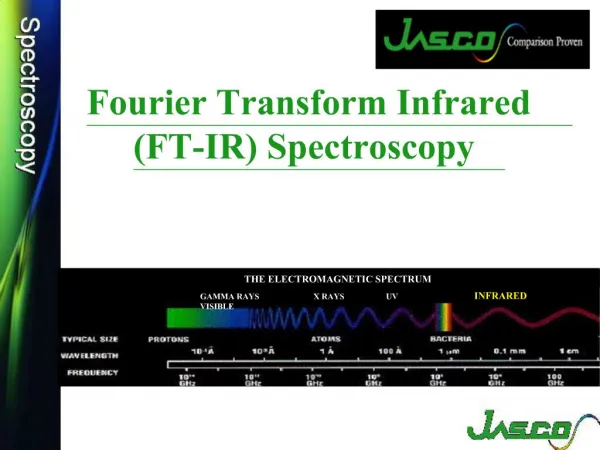
Lecture 6. FT-IR and Raman Spectroscopy. FT-IR. Analytical infrared studies are based on the absorption or reflection of the electromagnetic radiation that lies between 1 and 1000µm.

E N D
FT-IR • Analytical infrared studies are based on the absorption or reflection of the electromagnetic radiation that lies between 1 and 1000µm. • Infrared or IR analysis is one of the most common spectroscopic techniques used for compound identification and concentration measurements.
Three forms of IR • Near IR – (1 – 2.5µm) • Mid IR – (2.5 - 50µm) • Far IR – (beyond 50µm)
Principle • The absorption of light in the near and the mid IR regions occurs when the chemical bonds of a sample interact with the radiation of a light source. • When the chemical bonds contain different atoms situated at the two ends of the bond, they form an electric dipole which oscillates at a set frequency.
Due to the asymmetry of the bonds, interactions between the bonds and monochromatic light can occur if the frequency of the light is equal to the frequency of the dipole. • Therefore, the electrical component of the light can transfer its energy to the bond if the mechanical frequency of the bond and the electromagnetic frequency of the light are the same.
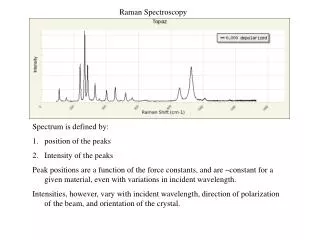
Absorptions in the Infrared • When a range of radiation wavelengths are used, the generated data or infrared absorption information is presented in the form of a spectrum, which is the basic document issued from a spectrometer. • The values of wavelengths are substituted by their equivalent wavenumbers ‾ whose units are in cm-1. v
Sample preparation • Almost any solid, liquid or gas sample can be analyzed • Little or no preparation is required, may have to grind solid into KBr matrix or dissolve sample in a suitable solvent (CCl4 and CS2 are preferred) • Water should be removed from sample if possible • Most samples can be prepared for infrared (IR) analysis in approximately 1 to 5 min.
limitations • Minimal elemental information is given for most samples. • Background solvent or solid matrix must be relatively transparent in the spectral region of interest. • Molecule must be active in the IR region.
Mid-IR Principles • Atoms within molecules are in constant motion and can move in three different directions. These movements are referred to as the three classical Cartesian coordinates. • All of these movements confer upon each isolated molecule a combined mechanical energy.
The total molecular energy occurs from the sum of the independent quantified terms named energy of rotation Erot, energy of vibration Evib, and electronic molecular energy Eelec: Etot = Erot + Evib + Eelec The values of these energies can be indepenent from each other based on Born-Oppenheimer principle.
For example, a radiation source emitting 1000 cm-1 corresponds to a photon energy E = hcv = 0.125 eV in the mid-IR region. • If this photon or radiation is absorbed by a molecule its total energy will be increased by this energy. • In theory, the energy of vibration Evib will be changed but the electronic molecular energy Eelec will not change due to insufficient transition energy between two different electronic levels.
When utilizing IR, samples usually consist of condensed liquids or solid phases in pure or diluted solutions. • For example, in a case study of headbox analysis of alkaline fine paper, headbox deposits sample along with spectra of wood pitch fatty acid salt and the fatty acid salt of hydrolyzed ASA were taken.
Deposit spectra was similar to the reference material • The spectra for bentonite (montmorillonite clay) and kaolin clay have peaks at around 3600 cm-1. • Montmorillonite clay and kaolin clay had peaks similar to O-H stretching • Deposit sample did not have any peak at 3600cm-1
References • Silverstein, M, Robert., Webster, X, Francis., Kiemle, D., Spectrometric Identification of Organic Compounds, John Wiley & Sons; 7 edition