Download
1 / 21
210 likes | 337 Vues
The micro-geography of UK demographic change 1991-2001 Paul Norman School of Geography, University of Leeds understanding population trends and processes ESRC RES-163-25-0012 for 2005-07 @ 40%. The micro-geography of UK demographic change 1991-2001

E N D
The micro-geography of UK demographic change 1991-2001 • Paul Norman • School of Geography, University of Leeds • understanding population trends and processes • ESRC RES-163-25-0012 for 2005-07 @ 40%
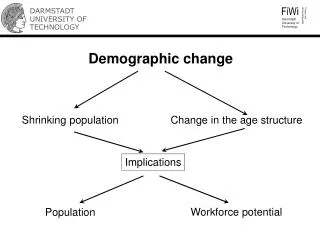
The micro-geography of UK demographic change 1991-2001 • Aim to quantify and map changes in population size and social characteristics occurring in UK’s small geographical areas between the 1991 and 2001 Censuses • Population change • Which demographic components account for change? Balance between natural change & migration change • Is the population ageing evenly? • Area characteristics change • Are areas becoming more or less deprived over time? • Health change • Relationship to changes in population & deprivation
The micro-geography of UK demographic change 1991-2001 • Introduction • UK area typologies • Technical challenges • Results • Demographic change • Deprivation change • Health change
Area typologies • ONS classification: districts • Cities & Services • Coastal & Countryside • London • Mining & Manufacturing • Prospering UK • Urban / rural: wards • 5 level categorisation of population density • Deprivation: wards • Categorised into quintiles
Technical challenges • 1991 and 2001 mid year small area populations not comparable: • Boundary changes • Differences in 1991 & 2001 Census population definition (location of student enumeration) • To estimate a 1991 base population, need to: • Adjust populations to mid-year & to a consistent geography • Allow for changed view of level of 1991 Census undercount • To calculate area deprivation, need to: • Create consistent variables by geography & definition • Ensure 1991 & 2001 measures are comparable
1991-2001 population change Population change Net migration Natural change
1991-2001 change Urban / Rural areas
1991-2001 change Deprivation of areas
1991-2001 net migration rates Deprivation 2001 Urban / Rural 2001
1991-2001 age Average age 1991 Change in average age
1991-2001 ageing Urban / Rural areas
1991-2001 ageing Deprivation of areas
Deprivation change Townsend Index
Deprivation change & mortality SMRs 2001
Deprivation change & limiting long-term illness (LLTI) SIRs 2001
SMRs 2001 Population change & mortality SMRs 2001
SIRs 2001 Population change & LLTI SIRs 2001
Summary • Population change 1991-2001 • Populations in most urban & more deprived areas maintained by natural change gain • Population moving away from more urban & more deprived areas to less deprived, semi-urban locations • More urban & deprived areas younger age population than less urban & non-deprived areas • Least deprived & most rural ageing most
Health change 1991-2001 • Mortality relates more strongly to deprivation than to larger area type with mortality improving over the decade • Generally, areas becoming less deprived have better health than those remaining the same or becoming more deprived • Generally, areas growing & areas of net migration gain have better health than areas contracting or experiencing net migration loss
Further work … Analyse by country/GOR Aggregate by ‘OPCS’ classification Do some writing!!