
Uploaded by
orien
16 SLIDES
251 VUES
160LIKES
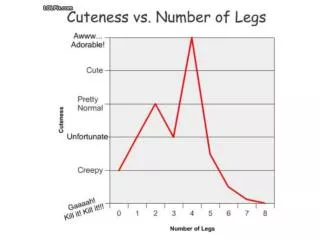
Importance of Graphs in Data Analysis
DESCRIPTION
Graphs are used to visually represent and organize data, aiding in clear interpretation and analysis. Graphs help identify trends, patterns, and outliers efficiently, such as determining the year with the least dolphin sightings. Did you refer to the chart or graph, or both, to reach your conclusion?
Download
1 / 16
Télécharger la présentation 
Importance of Graphs in Data Analysis
An Image/Link below is provided (as is) to download presentation
Download Policy: Content on the Website is provided to you AS IS for your information and personal use and may not be sold / licensed / shared on other websites without getting consent from its author.
Content is provided to you AS IS for your information and personal use only.
Download presentation by click this link.
While downloading, if for some reason you are not able to download a presentation, the publisher may have deleted the file from their server.
During download, if you can't get a presentation, the file might be deleted by the publisher.
E N D
Presentation Transcript
Why do we use Graphs? 1. Visual representation of data 2. To organize data
In which year were the least amount of dolphins seen? Did you use the chart or the graph or both to find your answer?


More Related
Audio
Live Player