Download
1 / 8

E N D
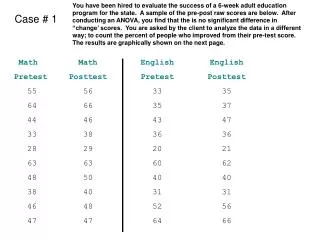
You have been hired to evaluate the success of a 6-week adult education program for the state. A sample of the pre-post raw scores are below. After conducting an ANOVA, you find that the is no significant difference in “change’ scores. You are asked by the client to analyze the data in a different way; to count the percent of people who improved from their pre-test score. The results are graphically shown on the next page. Case # 1 Math Pretest 55 64 44 33 28 63 48 38 46 47 Math Posttest 56 66 46 38 29 63 50 40 48 47 English Pretest 33 35 43 36 20 60 40 31 52 64 English Posttest 35 37 47 36 21 62 40 31 56 66
The client wants you to include this analysis in your final report. What should you do? % increase 100 90 80 70 60 50 40 30 20 10 0 The “Product” Math English
A company hires you to analyze customer complaints as part of a larger evaluations study of their performance. You produce a preliminary graph (below). The organization believes that this could be “misinterpreted” to indicate that customer complaints are higher in the summer when they often cut back on temporary staff. So, they request that you represent the data in a different form (see next page) Case # 2 10 9 8 7 6 5 4 3 2 1 0 J F M A M J Jul Aug S O N D
Case # 2 (cont.) 50 45 40 35 30 25 20 15 10 5 0 How would you respond to their request? J F M A M J Jul Aug S O N D
Case # 3 As a consultant you are ask to evaluate the effectiveness of an organization’s recent drug testing program. The company provides you with data that suggests the program was a success. That is, the year before drug testing began (1995), the number of accidents was 50. In 1996, the year testing was initiated, the amount dropped to 40. In 1997, the year following the program, the number of accident dropped to 29. Your preliminary analysis to the company is summarized below, a finding which is widely touted by the organization (e.g., company CEO, local newspaper, trade magazine). 55 50 45 40 35 30 25 20 15 10 5 * * * 1995 Drug Testing 1997
Case # 3 (cont.) * 65 60 55 50 45 40 35 30 25 20 15 After further analysis of company data, you develop the graph below. How would you handle this situation? * * * * * * * * 1992 1993 1994 1995 1996 1997 1998 1999 2000
Case # 4 You have been hired to perform a validation study to assess the predictive nature of a large-scale assessment center for a multi-national corporation. The results of your work are summarized below. Correlations with job performance (corrected for attenuation & range restriction) Correlations with job performance Correlations with job performance (corrected for attenuation) Assessment Center Exercise Scores Leadership Decisiveness Planning & Organization Resilience Verbal Communication Written Communication Initiative Total Score .16 .12 .11 .05 .22 .20 .14 .24 .18 .14 .13 .06 .24 .23 .17 .27 .20 .16 .13 .07 .32 .30 .21 .31
Case # 4 (cont.) After seeing the results of your investigation, the company wants you to produce an executive report (summary) highlighting the twice corrected correlations, and to not include the lower (uncorrected, less-corrected ones). The ask that these correlations be included in a lengthy final report, perhaps in an appendix. What would you do in this instance?