Advanced EDS Fundamentals for Electron Microscopy: Techniques & Accuracy Insights
This document provides a comprehensive overview of Energy Dispersive X-ray Spectroscopy (EDS) integrated with Scanning Electron Microscopy (SEM), detailing essential techniques, elemental analysis, and the importance of accuracy and beam control. It highlights practical applications, inherent challenges, and offers guidance for qualitative and quantitative analysis, emphasizing the use of reliable references. Educators and researchers in biology, materials science, and geology can greatly benefit from the insights shared within, especially concerning the interactions of electrons and matter and how to optimize their experimental setups.


Advanced EDS Fundamentals for Electron Microscopy: Techniques & Accuracy Insights
E N D
Presentation Transcript
place photo here Quantrainx50 7.2EDS Basic 3-2010 Confidential
EDS • Universal applications • Elemental analysis • 1% Accuracy • Beam Control / Imaging • Repeatable
References (“the Book” --Highly Recommended) • Scanning Electron Microscopy and X-Ray MicroanalysisA Text for Biologists, Materials Scientists, and Geologists, Joseph I. Goldstein, Dale E. Newbury, Patrick Echlin, David C. Joy, A.D. Romig, Jr., Charles E. Lyman, Charles Fiori, Eric Lifshin, Plenum Press, New York, 1992. (ISBN -- 0-306-44175-6) • *(Many thanks to Dr. Bob Anderhalt for graphics and advisement)
Example of Quantax50/EDAX Integration OUT DATED IMAGE !!!
N shell • M shell • L shell • K shell Your Basic Bohr Atom
Inelastic Collision • N shell Primary Beam Electron • M shell Secondary Electron • L shell • K shell • Forward ScatteredElectron
Inelastic Collision • Emitted X-ray • N shell • M shell Secondary Electron • L shell • K shell • Forward ScatteredElectron
N shell • M shell • L shell • K shell X-ray Transitions g Transition β Transition α Transition
K α Transition • N shell • M shell K α Transition • L shell • K shell
K βTransition • N shell • M shell K β Transition • L shell • K shell
L α Transition • N shell • M shell L α Transition • L shell • K shell
Inelastic Collision Summary • Primary beam electron interacts with atom • There is an energy transfer • An electron from the atom is liberated • Creates a secondary electron (SE) • SE has low energy • The atom is excited and wants to return to a relaxed state • Characteristic X-ray is emitted
Continuum X-rays -(Background Radiation) Incident Electron Beam Ejected Electron White radiation (Continuum) Characteristic X-ray
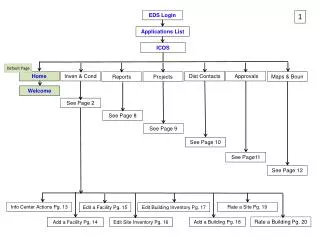
EDS Hardware SEM Column Monitor (MCA Display) Dewar FET Preamp Pole Piece Detector Analyzer Window SCSI Collimator Sample Stage
-500 to 1000 volts +,- charges Detector Detector Vacuum SiLi Detector Window 8u Be or 0.3u Polymer X-section of Window & Crystal to preamplifier (FET)
-500 to 1000 volts +,- charges Detector Detector Vacuum SiLi Detector Window 8u Be or 0.3u Polymer X-section of Window & Crystal to preamplifier (FET) 3.8 eV for each charge pair
-500 to 1000 volts +,- charges Detector Detector Vacuum SiLi Detector Window 8u Be or 0.3u Polymer X-section of Window & Crystal AlKa X-ray= 1.48KeV in to preamplifier (FET) 389 charge pairs out @ 3.8 eV each= 1.48KeV
How a Spectrum Grows Copper K α Kb L α Counts 8.044 Energy .938
Identification of all possible peaks Auto or Manual Peak ID Do not trust system : it is not 100% reliable Be aware of : - spectral artefacts - skirt effects (low vacuum systems) Qualitative analysis - Peak ID
Qualitative analysis - Peak ID • Identification of an element • Place cursor exact on the top of the peak (expand scale) • L and M line can show shift due to poor separation of /ß line • First check main lines such as L or M lines • Check the other lines of the same element • Heavy elements will produce K and L radiation
Qualitative analysis - Peak ID Manual ID (Z- Z+) steps along elements Auto ID EPIC table (Element Peak Identification chart) HPD : halographic peak deconvolution Peak Fit / (to check overlapping elements) Display possibilities Marker options : ESC - SUM
Qualitative analysis - Deconvolution • Deconvolution = peak strip method • Requires well calibrated system • Check deconvolution for overlapping elements and missing elements • Press HPD / Peak Fit button • Check other lines
What Affects Quantitative Analysis • K Ratio • Atomic Number (Z)Accelerating Voltage • Absorption (A)Take-Off Angle • Fluorescence (F)Atomic Matrix/Topography
What Affects Quantitative Analysis • K Ratio Unknown / Known ratio or Unknown Intensity / Pure Element Intensity
What Affects Quantitative Analysis • K Ratio • Atomic Number (Z)Accelerating Voltage 1.5 to 10 Times excitation energy Or 2 times the highest energy peak
Why should the overvoltage be less than 10 to 20 times the lowest energy peak? High overvoltage means a high absorption condition and a small peak and poor statsitics (again) X-Ray Generated Volume
Why should the overvoltage be at least 1.5 for the highest energy element? X-Ray Vol. Low overvoltage means a small, poorly excited peak and poor statistical quality in the spectrum Electron Volume
What Affects Quantitative Analysis • K Ratio • Atomic Number (Z)Accelerating Voltage • Absorption (A)Take-Off Angle
Take-off Angle • The take-off angle is the angle between the x-ray trajectory and the sample surface. • The angle is a combination of detector angle, its position, sample working distance, and sample tilt. • Typical angles will range from 25 - 40 degrees
Normal Take-Off Angle EDS Detector 35 º T-O Normal take -off Angle Allows Low Energy X-rays to Become Absorbed in Specimen
Greater Take-Off Angle EDS Detector Greater T-O Greater Take-Off Lets Low Energy X-rays Escape
Sample position is extremely important • Working distance is very important • Optimum sample position eucentric position = 10 mm (Sirion = 5 mm) • Field of view of the EDX detector : 9 -12 mm (Sirion : 5 - 6 mm) • Below 12 mm : inhomogeneous “illumination” of the field at lowmagnification
Ideal (Set-up) Detector Geometry Scale =50, EA = 35, Azimuth=45, ID= 10 (5) Intersection Distance/ Working Distance scale setting Elevation Angle
Various Detector Geometries • Intersection Distance • Elevation Angle • Working Distance • Take-Off Angle WD < ID TOA < EA ID EA Tilt > 0 TOA > EA WD > ID TOA > EA
What Affects Quantitative Analysis • K Ratio • Atomic Number (Z)Accelerating Voltage • Absorption (A)Take-Off Angle • Fluorescence (F)Atomic Matrix/ Topography
Fluorescence EDS Detector 35 º T-O High Energy X-ray Excites a Lower Atomic Number Atom
Other Issues with Quantitative Analysis BSE-image useful to determine if sample homogeneous SE-image BSE-image
Quantitative Analysis- Background Subtraction • Background needs to be removed before quantification • Auto or Manual method (new method Conc. Method - v3.2) • Manual method may improve BKGD fit • Background shape will affect the quantitative results : normally a very small effect • Pay attention to absorption edges • Glasses and minerals : Si absorption edge
Quantitative analysis - Deconvolution • Halographic peak fit procedure (HPD / Peak Fit) • Suitable to separate overlapping peaks • Sensitive to peak shift • Requires well calibrated system • Check deconvolution for missing elements • In case of poor results or bad fit: choose other line
Quantitative analysis - Matrix correction • Remove Background • Calculation of net peak intensity • K-ratio calculation • K-ratio = int. unknown peak / int. standard peak • Matrix correction for Z - A - F • Conc. = K-ratio / [ ZAF] • Different correction models
Quantitative analysis - Matrix correction • Different correction models to calculated ZAF factors • Two models : - ZAF correction model - Phi-Rho-Z correction model • Phi-Rho-Z model very suitable for light element quantification
Quantitative analysis - Matrix correction • Standardless analysis (normalise to 100%) • Flexible, kV independent • System needs kV to make a matrix correction • Every identified peak will be quantified • EDAX standardless calculation : WT% = Intensity measured /(P.E.I.F). X (SEC) ______________________________ (Z.A.F)
Quantitative analysis - standard less methods • 2 different methods • Standardless (normalisation to 100%) • Default SEC (standardless element co-efficient) • All SECs are set to 1.0 • Improved Standardless : updating the SECs - User table • Normally a few elements are updated to create more accuracy using standards • Only the updated elements are more accurate : rest still standardless • Mainly used for light elements- can be dangerous!!!
Quantitative analysis: SEC • SEC = standardless Element Coefficient • All default SECs are set to 1.0 • SEC’s have to be changed for the lighter elements only (B, C, N, O, F)
Poor Quantitative Analysis Conditions • Several situations where the calculation of the ZAF factor does not apply : - unsupported thin film - thin film on substrate - inclusion or particle - biological sample - particle on thin foil
Quantitative analysis - Sources of errors • Situation where the ZAF factors does not apply • X-ray interaction volume larger than phase size • Wrong coating (preferable Carbon-coating) • Poor statistics (acquisition time / countrate to low) • High count rate (high dead time) • Overlapping elements (trace elements) • Energy calibration errors • Improper background selection • Irregular specimen surfaces • Skirt effect (low vacuum SEM / ESEM)
Quantitative analysis - Summary • Background subtraction • Deconvolution : needs well calibrated system • Matrix correction models : ZAF,Phi-Rho-Z and Phi-ZAF • Several situations where the ZAF factors do not apply • Several errors possible
Interaction volume Effects of Specimen Surface on X-ray Emission Electron Beam EDS Detector Backscatter electrons Fluorescence X-rays Specimen Matrix Absorption of x-rays